

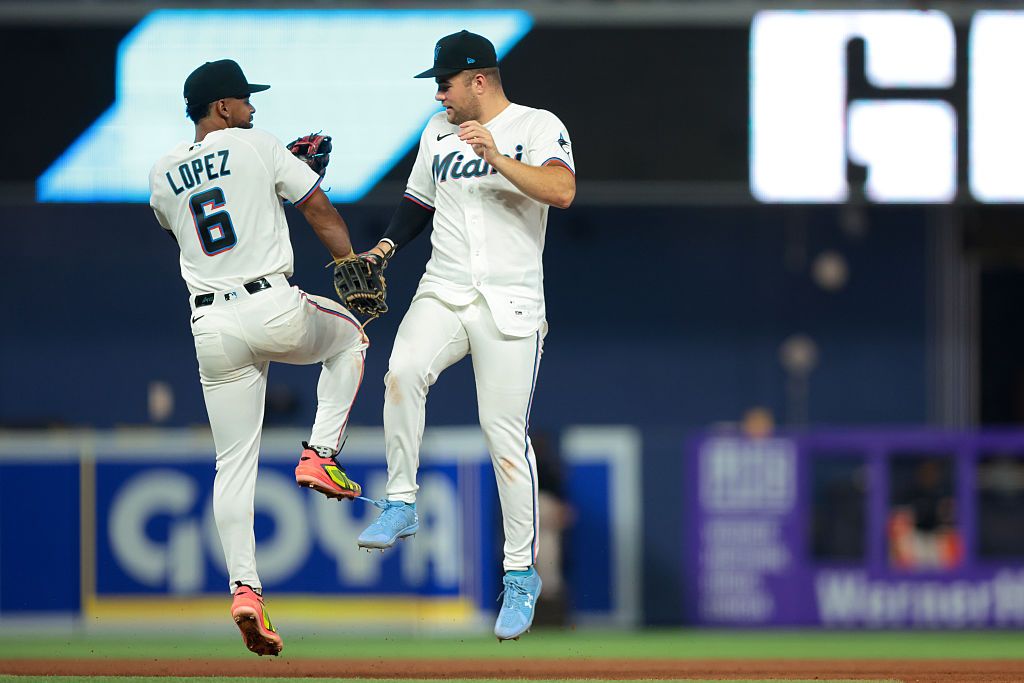
Looking for today’s New York Mets vs. Miami Marlins betting splits? Below you’ll find the latest DraftKings Sportsbook Moneyline, Run Line and total betting percentages, plus where the public and sharp money are landing before first pitch.
Mets vs. Marlins Odds
| Market | Mets (Home) | Marlins (Away) |
|---|---|---|
| Moneyline | -131 | +109 |
| Run Line | -1.5 (+159) | +1.5 (-193) |
| Total | Over 8.5 (-105) | Under 8.5 (-115) |
New York is a modest -131 home favorite at Citi Field, implying roughly 57% win probability. The Run Line prices the Mets at -1.5 (+159), reflecting a tight expected margin. The total is set at O/U 8.5 with the Under slightly juiced at -115.
DraftKings Betting Splits
| Market | Side | Bets % | Handle % |
|---|---|---|---|
| Moneyline | Mets | 63% | 62% |
| Moneyline | Marlins | 37% | 38% |
| Run Line | Mets -1.5 | 42% | 63% |
| Run Line | Marlins +1.5 | 58% | 37% |
| Total | Over 8.5 | 33% | 79% |
| Total | Under 8.5 | 67% | 21% |
Public Betting Trends
The Moneyline split is nearly flat with 63% of bets and 62% of handle on the Mets, indicating no sharp divergence on the side. The sharper signals emerge on the Run Line and total: only 42% of Run Line tickets back the Mets -1.5, yet 63% of handle sits there, a 21-point gap suggesting larger bettors see value in a multi-run Mets win. On the total, the Over commands a massive 79% of handle against just 33% of bets, a 46-point divergence that represents one of Friday’s strongest professional-money signals on a game total.
Mets vs. Marlins Stats
Starting Pitcher Stats
| Stat | Freddy Peralta (NYM) | Janson Junk (MIA) |
|---|---|---|
| Record | 5-9 | 4-6 |
| ERA | 4.99 | 4.89 |
| WHIP | 1.478 | 1.358 |
| FIP | 4.46 | 4.36 |
| xFIP | 4.28 | 4.32 |
| WAR | 1.19 | 1.00 |
| K% | 22.1% | 18.0% |
| BB% | 9.4% | 6.3% |
| HR/9 | 1.35 | 1.34 |
Team Pitching Stats
| Stat | Mets | Marlins |
|---|---|---|
| ERA | 4.11 | 4.08 |
| WHIP | 1.292 | 1.253 |
| K/9 | 9.17 | 8.55 |
| K/BB | 2.61 | 2.46 |
| OBA | .237 | .231 |
Team Batting Stats
| Stat | Mets | Marlins |
|---|---|---|
| AVG | .233 | .251 |
| OBP | .305 | .326 |
| SLG | .382 | .407 |
| OPS | .687 | .733 |
| ISO | .149 | .156 |
| K% | 22.5% | 21.7% |
Key Matchup Numbers
- Mets injuries thin the lineup: Juan Soto (calf, D10 since July 24) and Mark Vientos (hand, D10 since July 9) are both sidelined, removing two of New York’s most productive bats. Without Soto and Vientos, the Mets are relying on Tyrone Taylor (.281 AVG, .911 OPS at home) and A.J. Ewing (.288 AVG, .856 OPS at home) to carry the offensive load.
- Pitching matchup is essentially even: Peralta (4.99 ERA, 4.46 FIP) and Junk (4.89 ERA, 4.36 FIP) are nearly identical by surface stats and underlying metrics. The key difference is strikeout ability: Peralta’s 22.1% K-rate versus Junk’s 18.0%, though Peralta’s 9.4% walk rate gives back some of that advantage by creating extra baserunners.
- Marlins own the better offense: Miami’s .733 OPS significantly outpaces New York’s .687, and the Marlins feature Otto Lopez (.325 AVG, .845 OPS on the road) as one of the hottest hitters in baseball away from home. Lopez ranks 7th in MLB with 206 total bases and is the focal point of DraftKings’ Barrel Brigade parlay at 2+ total bases.
- Over 8.5 sharp conviction: The total draws 79% of handle on just 33% of bets, a 46-point gap indicating heavy professional money on the Over. Both starters carry ERAs near 5.00 with WHIPs above 1.35, and neither team’s staff pitching metrics (4.11 and 4.08 ERA) suggest a low-scoring environment. Peralta’s 1.35 HR/9 and Junk’s 1.34 HR/9 further support elevated scoring.
- Road power threats for Miami: Heriberto Hernandez (.238 AVG, .793 OPS, 8 HR on the road), Kyle Stowers (.254, .793 OPS, 7 HR), and Joe Mack (.237, .790 OPS, 8 HR) provide legitimate pop in the middle of the Marlins lineup. Combined with Lopez at the top, Miami’s road lineup profiles well against Peralta’s high walk rate.
- Mets’ home struggles: New York carries a 25-31 home record and sits 5th in the NL East at 47-63 overall. The Marlins, despite a mediocre 21-32 road mark, are 55-55 on the season and hold the better overall record by 8 games. The line reflects how close this matchup truly is despite the Mets holding home-field advantage.
DraftKings Player Props
- Freddy Peralta Strikeouts Thrown O/U 5.5 (Over +111 / Under -142)
- Freddy Peralta Hits Allowed O/U 4.5 (Over -147 / Under +111)
- Janson Junk Outs O/U 15.5 (Over -130 / Under -102)
- Otto Lopez Total Bases O/U 1.5 (Over +118 / Under -157)
- Francisco Lindor Total Bases O/U 1.5 (Over +114 / Under -152)
- Bo Bichette Hits O/U 0.5 (Over -247 / Under +182)
- Griffin Conine Hits O/U 0.5 (Over -134 / Under +101)
- Carson Benge Total Bases O/U 1.5 (Over +129 / Under -172)
DraftKings Featured Parlays
Donut Delivery (+1328)
Four Friday games stay scoreless through the first inning.
- PHI @ BAL: No Runs 1st Inning
- ARI @ CLE: No Runs 1st Inning
- MIA @ NYM: No Runs 1st Inning
- WAS @ ATL: No Runs 1st Inning
Home Heat (+1380)
Five home clubs win in front of their crowd on Friday night.
- TOR Blue Jays to Win (vs STL)
- CLE Guardians to Win (vs ARI)
- NY Mets to Win (vs MIA)
- TB Rays to Win (vs CWS)
- ATL Braves to Win (vs WAS)
On the Road Again (+2209)
Five road teams pull off victories away from home on Friday.
- PIT Pirates to Win (@ CIN)
- ARI Diamondbacks to Win (@ CLE)
- MIA Marlins to Win (@ NYM)
- KC Royals to Win (@ COL)
- MIL Brewers to Win (@ LAA)
Barrel Brigade (+1662)
Four of MLB’s total-base leaders each record 2+ total bases.
- James Wood 2+ Total Bases
- Kyle Schwarber 2+ Total Bases
- Otto Lopez 2+ Total Bases
- Ketel Marte 2+ Total Bases
Betting Splits Summary
| Metric | Mets / Over | Marlins / Under |
|---|---|---|
| ML Handle | 62% | 38% |
| ML Bets | 63% | 37% |
| RL Handle | 63% | 37% |
| RL Bets | 42% | 58% |
| Total Handle | 79% | 21% |
| Total Bets | 33% | 67% |
FAQs
What are MLB betting splits?
Betting splits show how the public is wagering on a game by breaking down the percentage of total bets (tickets) and total money (handle) on each side of a market. They help identify which side recreational bettors favor versus where larger, potentially sharper money is landing.
What is the difference between bets and handle?
Bets refer to the number of individual tickets placed, while handle represents the total dollar amount wagered. A side with low bet percentage but high handle percentage suggests fewer bettors placing larger wagers, often interpreted as sharp or professional action.
How do betting splits identify sharp money?
Sharp money refers to wagers placed by professional or highly informed bettors. It is typically identified through handle-vs-bet discrepancies: when a side draws a disproportionate share of money relative to its ticket count, sharps are likely involved.
Should you follow betting splits?
Splits are one tool among many. They are most useful when a clear divergence exists between public tickets and money handle, suggesting professional disagreement with the recreational consensus. They work best combined with line movement analysis and matchup context.
How often do DraftKings betting splits update?
DraftKings betting splits update approximately every two minutes, providing near real-time insight into how the market is moving as game time approaches.
What is the best bet for Mets vs. Marlins?
The sharpest signal in this game points to the Over 8.5 runs. The Over commands 79% of handle on just 33% of bets, a 46-point gap that represents one of Friday’s strongest professional-money signals. Supporting the lean: both starters carry ERAs near 5.00 with WHIPs above 1.35, Peralta’s 9.4% walk rate creates free traffic, and both pitchers surrender home runs at 1.34-1.35 per nine innings. Miami’s road lineup features Otto Lopez (.325 AVG), Heriberto Hernandez (8 HR), and Joe Mack (8 HR) as legitimate power threats against a pitcher who walks nearly one in ten batters.
