

Looking for today’s Detroit Tigers vs. Kansas City Royals betting splits? Below you’ll find the latest DraftKings Sportsbook Moneyline, Run Line and total betting percentages, plus where the public and sharp money are landing before first pitch.
Tigers vs. Royals Odds
| Market | Tigers (Home) | Royals (Away) |
|---|---|---|
| Moneyline | -205 | +168 |
| Run Line | -1.5 (-101) | +1.5 (-119) |
| Total | Over 8.5 (-102) | Under 8.5 (-118) |
Detroit is a strong home favorite at -205, implying roughly 67% win probability. The total sits at O/U 8.5 with slightly more juice on the Under. Kansas City at +168 offers significant underdog value, while the Tigers Run Line of -1.5 at -101 prices a multi-run Detroit victory as a coin flip.
DraftKings Betting Splits
| Market | Side | Bets % | Handle % |
|---|---|---|---|
| Moneyline | Tigers | 86% | 93% |
| Moneyline | Royals | 14% | 7% |
| Run Line | Tigers -1.5 | 76% | 95% |
| Run Line | Royals +1.5 | 24% | 5% |
| Total | Over 8.5 | 50% | 5% |
| Total | Under 8.5 | 50% | 95% |
Public Betting Trends
The Tigers are dominating both ticket count and handle on the Moneyline, with 86% of bets and 93% of handle landing on Detroit. That 7-point gap is modest but still signals larger wagers favoring the home side. The Run Line is where sharp confidence truly shows: Tigers -1.5 draws 95% of the handle on 76% of bets, a 19-point divergence indicating professional money expects Detroit to win comfortably. The most dramatic split sits on the total. Bets are perfectly split at 50/50 between Over and Under 8.5, but a staggering 95% of the handle backs the Under. That 45-point gap between ticket percentage and money percentage is one of the largest on any MLB slate today, pointing to concentrated sharp action expecting a low-scoring affair. The overall picture shows both public and sharp sides aligned on the Tigers, while the Under is the clearest sharp-only play of the game.
Tigers vs. Royals Stats
Team Batting Stats
| Team | AVG | OBP | SLG | ISO | OPS | K% |
|---|---|---|---|---|---|---|
| Tigers | .235 | .312 | .400 | .165 | .712 | 23.3% |
| Royals | .248 | .316 | .399 | .151 | .715 | 21.3% |
Team Pitching Stats
| Team | ERA | WHIP | K/9 | K/BB | OBA |
|---|---|---|---|---|---|
| Tigers | 3.64 | 1.223 | 8.60 | 2.77 | .234 |
| Royals | 4.93 | 1.438 | 7.73 | 2.00 | .263 |
Starting Pitcher Stats
| Pitcher | Record | ERA | WHIP | FIP | xFIP | WAR | K% | BB% | HR/9 |
|---|---|---|---|---|---|---|---|---|---|
| Troy Melton (DET) | 5-1 | 1.80 | 0.873 | 3.87 | 3.76 | 0.88 | 23.6% | 7.1% | 1.15 |
| Randy Dobnak (KC) | 0-0 | 1.93 | 1.500 | 5.68 | 5.36 | -0.16 | 11.3% | 12.9% | 1.29 |
Key Matchup Numbers
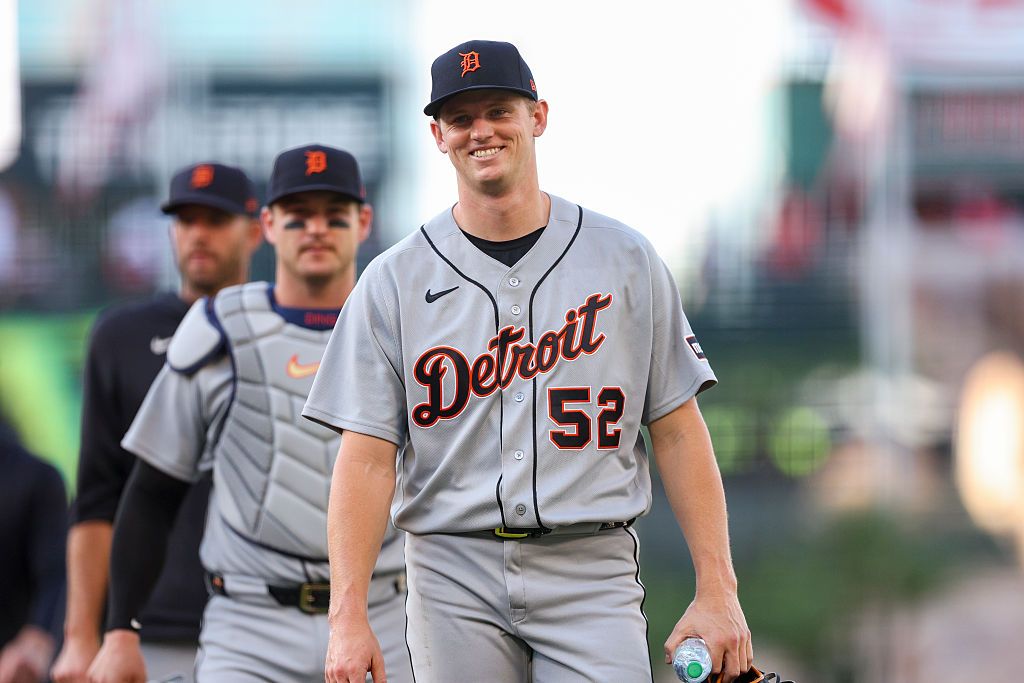
- Melton’s elite surface numbers: Troy Melton carries a 1.80 ERA and 0.873 WHIP into this start, making him one of the most dominant starters in baseball right now. His 23.6% strikeout rate paired with a 7.1% walk rate gives him outstanding command, and his 5-1 record reflects that dominance.
- FIP gap suggests some regression risk: Melton’s 3.87 FIP and 3.76 xFIP sit well above his 1.80 ERA, indicating some overperformance. However, pitching in front of Detroit’s strong defense and limiting walks (7.1% BB%) helps sustain a lower ERA than the estimators predict.
- Dobnak’s tiny sample and red flags: Randy Dobnak has made just one start with a 1.93 ERA, but his 1.500 WHIP, 5.68 FIP, and 5.36 xFIP scream regression. A 12.9% walk rate and 11.3% strikeout rate mean he is not missing bats and is putting runners on base constantly.
- Detroit’s pitching staff dominance: The Tigers own a 3.64 ERA, 1.223 WHIP, and 2.77 K/BB as a staff, ranking among baseball’s best. Kansas City’s 4.93 ERA and 1.438 WHIP represent a massive pitching disadvantage entering this series.
- Home split performers: Eduardo Valencia is slashing .500 with a 1.645 OPS and 2 home runs in 10 home at-bats for Detroit, while Jake Rogers owns a .273 average with a .934 OPS and 2 homers in 33 home at-bats. Kansas City’s best road bat, Tyler Tolbert, is hitting .351 with an .832 OPS.
The pitching mismatch defines this game. Melton’s dominance combined with Detroit’s elite staff ERA creates a clear edge, while Dobnak’s peripheral numbers suggest the Royals are vulnerable to a blowup despite the small-sample ERA.
Betting Splits Summary
| Metric | Tigers / Over | Royals / Under |
|---|---|---|
| Moneyline handle | 93% | 7% |
| Moneyline bets | 86% | 14% |
| Run Line handle | 95% | 5% |
| Run Line bets | 76% | 24% |
| Total handle | 5% | 95% |
| Total bets | 50% | 50% |
FAQs
What are MLB betting splits?
Betting splits show how the public is wagering on a game by breaking down the percentage of total bets (tickets) and total money (handle) on each side of a market. They help identify which side recreational bettors favor versus where larger, potentially sharper money is landing.
What is the difference between bets and handle?
Bets refer to the number of individual tickets placed, while handle represents the total dollar amount wagered. A side with low bet percentage but high handle percentage suggests fewer bettors placing larger wagers, often interpreted as sharp or professional action.
How do betting splits identify sharp money?
Sharp money refers to wagers placed by professional or highly informed bettors. It is typically identified through handle-vs-bet discrepancies: when a side draws a disproportionate share of money relative to its ticket count, sharps are likely involved.
Should you follow betting splits?
Splits are one tool among many. They are most useful when a clear divergence exists between public tickets and money handle, suggesting professional disagreement with the recreational consensus. They work best combined with line movement analysis and matchup context.
How often do DraftKings betting splits update?
DraftKings betting splits update approximately every two minutes, providing near real-time insight into how the market is moving as game time approaches.
What is the best bet for Tigers vs. Royals?
The sharpest action is the Under 8.5, with 95% of handle on 50% of bets, a staggering 45-point gap. The Run Line also shows heavy sharp confidence on Tigers -1.5 with 95% handle on 76% bets. Bettors looking for value should consider the Under 8.5 given the extreme handle divergence, Melton’s dominant 1.80 ERA, and Detroit’s elite pitching staff (3.64 ERA, 2.77 K/BB).