

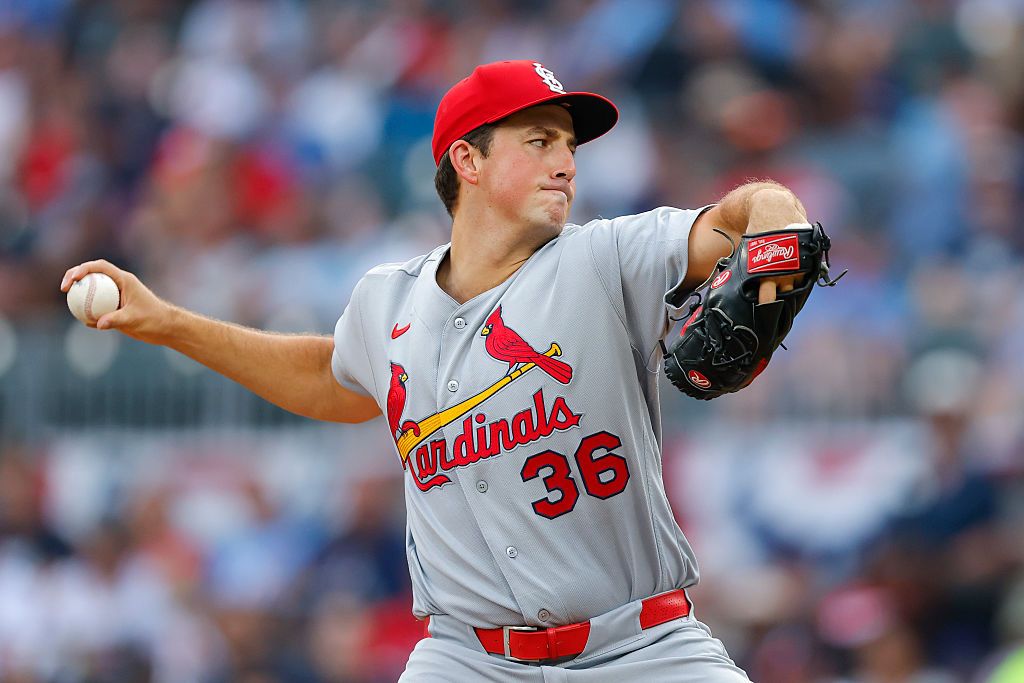
Looking for today’s St. Louis Cardinals vs. Arizona Diamondbacks betting splits? Below you’ll find the latest DraftKings Sportsbook Moneyline, Run Line and total betting percentages, plus where the public and sharp money are landing before first pitch.
Cardinals vs. Diamondbacks Odds
| Market | Cardinals (Home) | Diamondbacks (Away) |
|---|---|---|
| Moneyline | -125 | +103 |
| Run Line | -1.5 (+162) | +1.5 (-198) |
| Total | Over 8 (-105) | Under 8 (-114) |
The Cardinals are moderate home favorites at -125, implying roughly 56% win probability. The total sits at O/U 8 with slightly more juice on the Under. Arizona at +103 offers near even-money value, while the Cardinals Run Line of -1.5 at +162 provides plus-money for a multi-run St. Louis victory.
DraftKings Betting Splits
| Market | Side | Bets % | Handle % |
|---|---|---|---|
| Moneyline | Cardinals | 64% | 92% |
| Moneyline | Diamondbacks | 36% | 8% |
| Run Line | Cardinals -1.5 | 47% | 92% |
| Run Line | Diamondbacks +1.5 | 53% | 8% |
| Total | Over 8 | 81% | 85% |
| Total | Under 8 | 19% | 15% |
Public Betting Trends
Sharp money is pouring in on the Cardinals across both markets. On the Moneyline, St. Louis draws 92% of handle on 64% of bets, a 28-point gap that signals professional bettors are backing the home side with conviction. The Run Line tells an even more compelling story: 92% of handle sits on Cardinals -1.5 despite only 47% of tickets landing there, a massive 45-point divergence that ranks among the sharpest signals on today’s slate. The majority of the public is actually taking Diamondbacks +1.5 (53% of bets), but the money emphatically disagrees. On the total, the Over 8 attracts both public and sharp interest with 81% of bets and 85% of handle, a relatively aligned profile suggesting broad consensus on a higher-scoring game.
Cardinals vs. Diamondbacks Stats
Team Batting Stats
| Team | AVG | OBP | SLG | ISO | OPS | K% |
|---|---|---|---|---|---|---|
| Cardinals | .240 | .316 | .384 | .144 | .700 | 20.6% |
| Diamondbacks | .240 | .311 | .393 | .153 | .704 | 19.6% |
Team Pitching Stats
| Team | ERA | WHIP | K/9 | K/BB | OBA |
|---|---|---|---|---|---|
| Cardinals | 4.12 | 1.328 | 7.64 | 2.26 | .251 |
| Diamondbacks | 4.21 | 1.285 | 6.93 | 2.36 | .252 |
Starting Pitcher Stats
| Pitcher | Record | ERA | WHIP | FIP | xFIP | WAR | K% | BB% | HR/9 |
|---|---|---|---|---|---|---|---|---|---|
| Michael McGreevy (STL) | 4-7 | 2.92 | 1.102 | 4.14 | 4.06 | 1.33 | 16.6% | 5.6% | 1.17 |
| Brandon Pfaadt (ARI) | 4-1 | 4.58 | 1.305 | 4.50 | 4.36 | 0.41 | 17.3% | 7.1% | 1.22 |
Key Matchup Numbers
- McGreevy’s surface dominance: Michael McGreevy carries a 2.92 ERA and 1.102 WHIP into this start, significantly outperforming Pfaadt’s 4.58 ERA and 1.305 WHIP. His 5.6% walk rate gives him elite command, and while his 16.6% strikeout rate is modest, the low free passes keep his pitch count efficient.
- FIP gap suggests regression: McGreevy’s 4.14 FIP and 4.06 xFIP sit well above his ERA, indicating some overperformance. However, the gap may partially reflect his ground-ball tendencies and stingy walk rate rather than pure luck.
- Arizona’s pitching depth crisis: The Diamondbacks are missing Corbin Burnes, Ryne Nelson, and Cristian Mena, all on the 60-day IL with arm injuries. That leaves Arizona’s rotation stretched thin, and its bullpen carrying a heavier workload down the stretch.
- Home split advantage for St. Louis: Jordan Walker is slashing .302 with an .851 OPS and 9 home runs at home (189 AB), while Lars Nootbaar owns a .950 OPS in 53 home at-bats. The Cardinals lineup performs notably better at Busch Stadium.
- Arizona road form: The Diamondbacks are 22-27 on the road this season, but enter on a 2-game winning streak and are 8-2 in their last 10. Gabriel Moreno has been dominant away from home, slashing .346 with a .928 OPS and 4 homers in 127 road at-bats.
The sharp money alignment with the Cardinals reflects a clear pitching edge for McGreevy at home, and Arizona’s depleted rotation makes it difficult for the Diamondbacks to match that output on the mound.
Betting Splits Summary
| Metric | Cardinals / Over | Diamondbacks / Under |
|---|---|---|
| Moneyline handle | 92% | 8% |
| Moneyline bets | 64% | 36% |
| Run Line handle | 92% | 8% |
| Run Line bets | 47% | 53% |
| Total handle | 85% | 15% |
| Total bets | 81% | 19% |
FAQs
What are MLB betting splits?
Betting splits show how the public is wagering on a game by breaking down the percentage of total bets (tickets) and total money (handle) on each side of a market. They help identify which side recreational bettors favor versus where larger, potentially sharper money is landing.
What is the difference between bets and handle?
Bets refer to the number of individual tickets placed, while handle represents the total dollar amount wagered. A side with low bet percentage but high handle percentage suggests fewer bettors placing larger wagers, often interpreted as sharp or professional action.
How do betting splits identify sharp money?
Sharp money refers to wagers placed by professional or highly informed bettors. It is typically identified through handle-vs-bet discrepancies: when a side draws a disproportionate share of money relative to its ticket count, sharps are likely involved.
Should you follow betting splits?
Splits are one tool among many. They are most useful when a clear divergence exists between public tickets and money handle, suggesting professional disagreement with the recreational consensus. They work best combined with line movement analysis and matchup context.
How often do DraftKings betting splits update?
DraftKings betting splits update approximately every two minutes, providing near real-time insight into how the market is moving as game time approaches.
What is the best bet for Cardinals vs. Diamondbacks?
The sharpest action is on Cardinals -1.5 at +162, with 92% of handle on just 47% of bets, a massive 45-point divergence. The Moneyline also shows heavy sharp support for St. Louis with 92% handle on 64% bets. Bettors looking for value should consider the Cardinals Run Line given the extreme handle-to-bet gap and McGreevy’s superior surface metrics (2.92 ERA, 1.102 WHIP) at home.