

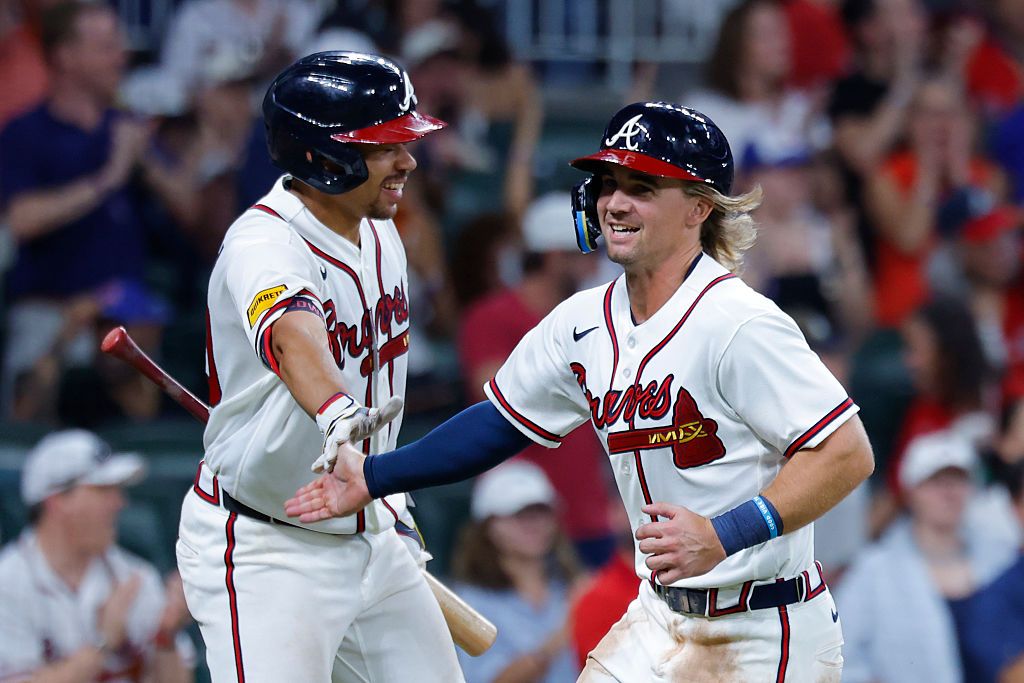
Looking for today’s Atlanta Braves vs. San Diego Padres betting splits? Below you’ll find the latest DraftKings Sportsbook Moneyline, Run Line and total betting percentages, plus where the public and sharp money are landing before first pitch.
Braves vs. Padres Odds
| Market | Braves (Home) | Padres (Away) |
|---|---|---|
| Moneyline | -261 | +210 |
| Run Line | -1.5 (-122) | +1.5 (+102) |
| Total | Over 8 (-109) | Under 8 (-111) |
Atlanta is a heavy home favorite at -261 on the Moneyline, with San Diego listed at +210 as the road underdog. The Run Line is set at 1.5 runs with the Braves at -122 to cover, and the total sits at O/U 8 with the Under slightly juiced to -111.
DraftKings Betting Splits
| Market | Side | Bets % | Handle % |
|---|---|---|---|
| Moneyline | Braves | 90% | 82% |
| Moneyline | Padres | 10% | 18% |
| Run Line | Braves -1.5 | 73% | 59% |
| Run Line | Padres +1.5 | 27% | 41% |
| Total | Over 8 | 52% | 75% |
| Total | Under 8 | 48% | 25% |
Public Betting Trends
The public is overwhelmingly on the Braves, with 90% of Moneyline tickets and 82% of handle backing Atlanta at -261. That lopsided action is expected given the massive price disparity and Chris Sale on the mound. The more telling divergence is on the total: the Over 8 draws 75% of handle on just 52% of tickets, a 23-point gap that signals sharp money positioned for a higher-scoring game. On the Run Line, Padres +1.5 quietly attracts 41% of handle on only 27% of bets, a 14-point sharp lean suggesting professionals expect a tighter margin than the Moneyline implies.
Braves vs. Padres Stats
Team Batting Stats
| Team | AVG | OBP | SLG | ISO | OPS | K% |
|---|---|---|---|---|---|---|
| Braves | .250 | .317 | .417 | .167 | .734 | 21.3% |
| Padres | .230 | .307 | .383 | .153 | .690 | 22.4% |
Team Pitching Stats
| Team | ERA | WHIP | K/9 | K/BB | OBA |
|---|---|---|---|---|---|
| Braves | 3.67 | 1.238 | 8.57 | 2.52 | .231 |
| Padres | 4.24 | 1.344 | 8.29 | 2.26 | .248 |
Starting Pitcher Stats
| Pitcher | Record | ERA | WHIP | FIP | xFIP | WAR | K% | BB% | HR/9 |
|---|---|---|---|---|---|---|---|---|---|
| Chris Sale (ATL) | 10-6 | 2.06 | 1.057 | 2.72 | 3.13 | 3.13 | 28.9% | 5.9% | 0.69 |
| Griffin Canning (SD) | 1-8 | 6.67 | 1.618 | 4.81 | 4.53 | 0.29 | 22.3% | 12.1% | 1.37 |
Key Matchup Numbers
- Over 8 sharp signal: The total Over draws 75% of handle on only 52% of bets, a 23-point divergence that represents the sharpest action on this board. Professional money is betting on runs despite Sale’s dominance, likely targeting Canning’s 6.67 ERA and 1.618 WHIP.
- Massive pitching mismatch: Sale carries a 2.06 ERA, 1.057 WHIP, and 3.13 WAR against Canning’s 6.67 ERA, 1.618 WHIP, and 0.29 WAR. The gap in FIP (2.72 vs. 4.81) confirms this is not luck-driven.
- Padres +1.5 handle lean: Despite 73% of Run Line bets on the Braves, Padres +1.5 holds 41% of handle on 27% of tickets. Sharps may be buying the plus-money cushion, expecting Canning to keep it competitive enough.
- Atlanta’s home dominance: The Braves are 31-20 at home and sit atop the NL East at 59-42. Drake Baldwin leads with a .299 average, 11 home runs, and .907 OPS in home splits.
- Canning’s walk problem: Griffin Canning’s 12.1% walk rate is more than double Sale’s 5.9%, creating free baserunners that could fuel Over backers. His 1.37 HR/9 compounds the damage when runners are aboard.
Sharp money on the Over aligns with the pitching mismatch. Canning’s walk rate and home-run tendency suggest Atlanta can score early and often, while even Sale’s excellence may not suppress enough Padres traffic to keep the game under 8 total runs.
Betting Splits Summary
| Metric | Braves / Over | Padres / Under |
|---|---|---|
| Moneyline handle | 82% | 18% |
| Moneyline bets | 90% | 10% |
| Run Line handle | 59% | 41% |
| Run Line bets | 73% | 27% |
| Total handle | 75% | 25% |
| Total bets | 52% | 48% |
FAQs
What are MLB betting splits?
Betting splits show how the public is wagering on a game by breaking down the percentage of total bets (tickets) and total money (handle) on each side of a market. They help identify which side recreational bettors favor versus where larger, potentially sharper money is landing.
What is the difference between bets and handle?
Bets refer to the number of individual tickets placed, while handle represents the total dollar amount wagered. A side with low bet percentage but high handle percentage suggests fewer bettors placing larger wagers, often interpreted as sharp or professional action.
How do betting splits identify sharp money?
Sharp money refers to wagers placed by professional or highly informed bettors. It is typically identified through handle-vs-bet discrepancies: when a side draws a disproportionate share of money relative to its ticket count, sharps are likely involved.
Should you follow betting splits?
Splits are one tool among many. They are most useful when a clear divergence exists between public tickets and money handle, suggesting professional disagreement with the recreational consensus. They work best combined with line movement analysis and matchup context.
How often do DraftKings betting splits update?
DraftKings betting splits update approximately every two minutes, providing near real-time insight into how the market is moving as game time approaches.
What is the best bet for Braves vs. Padres?
The sharpest action by handle percentage is on the Over 8 at -109, with 75% of dollars backing that side on just 52% of bets, a 23-point divergence that represents the clearest sharp signal on this game. The Padres +1.5 Run Line at +102 also shows a mild sharp lean with 41% of handle on 27% of tickets. Bettors looking for the strongest sharp signal should favor the Over given the handle concentration, Canning’s 12.1% walk rate, and the pitching mismatch that projects Atlanta to score freely.