

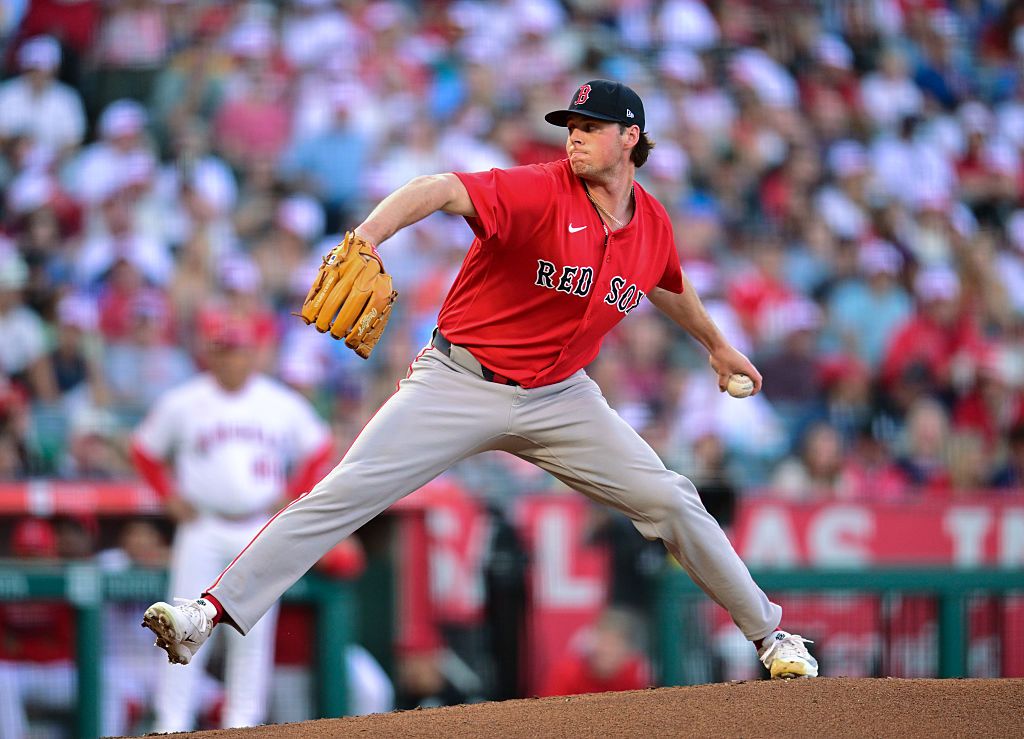
Looking for today’s Boston Red Sox vs. Baltimore Orioles betting splits? Below you’ll find the latest DraftKings Sportsbook Moneyline, Run Line and total betting percentages, plus where the public and sharp money are landing before first pitch.
Red Sox vs. Orioles Game 1 Odds
| Market | Red Sox (Home) | Orioles (Away) |
|---|---|---|
| Moneyline | -150 | +124 |
| Run Line | -1.5 (+140) | +1.5 (-170) |
| Total | Over 9 (-120) | Under 9 (-101) |
Boston is listed as a moderate home favorite at -150 on the Moneyline, with the total set at O/U 9. The Run Line prices the Red Sox at +140 to win by two or more runs, reflecting the expectation of a competitive game despite Boston’s dominant recent form.
DraftKings Betting Splits
| Market | Side | Bets % | Handle % |
|---|---|---|---|
| Moneyline | Red Sox | 88% | 84% |
| Moneyline | Orioles | 12% | 16% |
| Run Line | Red Sox | 83% | 46% |
| Run Line | Orioles | 17% | 54% |
| Total | Over 9 | 47% | 81% |
| Total | Under 9 | 53% | 19% |
Public Betting Trends
The public favors the Red Sox with 88% of Moneyline bets, but the Orioles command 16% of the handle on just 12% of tickets, a 4-point sharp lean. The Run Line divergence is even starker: 54% of handle backs Orioles +1.5 on just 17% of bets, a 37-point split. The Over 9 commands 81% of handle on 47% of tickets, with sharp money clearly positioned for a higher-scoring game.
Red Sox vs. Orioles Game 1 Stats
Team Batting Stats
| Team | AVG | OBP | SLG | ISO | OPS | K% |
|---|---|---|---|---|---|---|
| Red Sox | .245 | .315 | .394 | .149 | .709 | 21.9% |
| Orioles | .238 | .321 | .398 | .160 | .719 | 24.4% |
Team Pitching Stats
| Team | ERA | WHIP | K/9 | K/BB | OBA |
|---|---|---|---|---|---|
| Red Sox | 3.55 | 1.22 | 8.66 | 2.95 | .237 |
| Orioles | 4.21 | 1.35 | 8.03 | 2.32 | .252 |
Starting Pitcher Stats
| Pitcher | Record | ERA | WHIP | FIP | xFIP | WAR | K% | BB% | HR/9 |
|---|---|---|---|---|---|---|---|---|---|
| Jake Bennett (BOS) | 5-3 | 2.35 | 0.876 | 3.03 | 3.83 | 1.51 | 18.7% | 3.9% | 0.50 |
| Dean Kremer (BAL) | 1-2 | 4.15 | 1.115 | 6.18 | 3.46 | -0.24 | 28.2% | 6.8% | 3.12 |
Key Matchup Numbers
- Red Sox momentum: Boston is riding a 14-game winning streak and is a perfect 10-0 in its last 10 games, making it one of the hottest teams in baseball right now.
- Run Line sharp signal: The Run Line split shows a significant sharp money signal: only 17% of bets are on BAL +1.5, but those tickets account for 54% of the total handle, suggesting larger wagers backing the Orioles to stay within 1.5 runs.
- Over sharp action: The Total market features an even larger discrepancy, with 81% of handle on the Over despite only 47% of tickets. This is a textbook sharp action indicator on Over 9.
- Kremer vulnerability: Dean Kremer carries a 6.18 FIP and a staggering 3.12 HR/9 in five starts this season, making him vulnerable to a Boston lineup that has been scoring consistently during its streak.
- Injury impact: Baltimore is missing key position players Jordan Westburg (3B, UCL) and Ryan Mountcastle (1B, Foot) on the D60 IL, while Boston is without Triston Casas (1B, Knee) and multiple starting pitchers (Houck, Crochet, Oviedo).
The splits tell a clear story of sharp bettors diverging from the public. While recreational money is loading up on Boston across the board, professionals are taking the points with Baltimore on the Run Line and hammering the Over. Bennett’s elite 2.35 ERA gives Boston a pitching edge, but Kremer’s home run problems (3.12 HR/9) could fuel a high-scoring game that pushes this contest past the total.
Betting Splits Summary
| Metric | Red Sox / Over | Orioles / Under |
|---|---|---|
| Moneyline handle | 84% | 16% |
| Moneyline bets | 88% | 12% |
| Run Line handle | 46% | 54% |
| Run Line bets | 83% | 17% |
| Total handle | 81% | 19% |
| Total bets | 47% | 53% |
FAQs
What are MLB betting splits?
Betting splits show how the public is wagering on a game by breaking down the percentage of total bets (tickets) and total money (handle) on each side of a market. They help identify which side recreational bettors favor versus where larger, potentially sharper money is landing.
What is the difference between bets and handle?
Bets refer to the number of individual tickets placed, while handle represents the total dollar amount wagered. A side with low bet percentage but high handle percentage suggests fewer bettors placing larger wagers, often interpreted as sharp or professional action.
How do betting splits identify sharp money?
Sharp money refers to wagers placed by professional or highly informed bettors. It is typically identified through handle-vs-bet discrepancies: when a side draws a disproportionate share of money relative to its ticket count, sharps are likely involved.
Should you follow betting splits?
Splits are one tool among many. They are most useful when a clear divergence exists between public tickets and money handle, suggesting professional disagreement with the recreational consensus. They work best combined with line movement analysis and matchup context.
How often do DraftKings betting splits update?
DraftKings betting splits update approximately every two minutes, providing near real-time insight into how the market is moving as game time approaches.
What is the best bet for Red Sox vs. Orioles Game 1?
The sharpest action in this game is on the Over 9, which commands 81% of the total handle while drawing only 47% of individual tickets. This massive 34-point handle-to-bet discrepancy is the strongest sharp signal across all three markets. The Run Line also shows professional lean toward BAL Orioles +1.5, with 54% of handle on just 17% of tickets.