

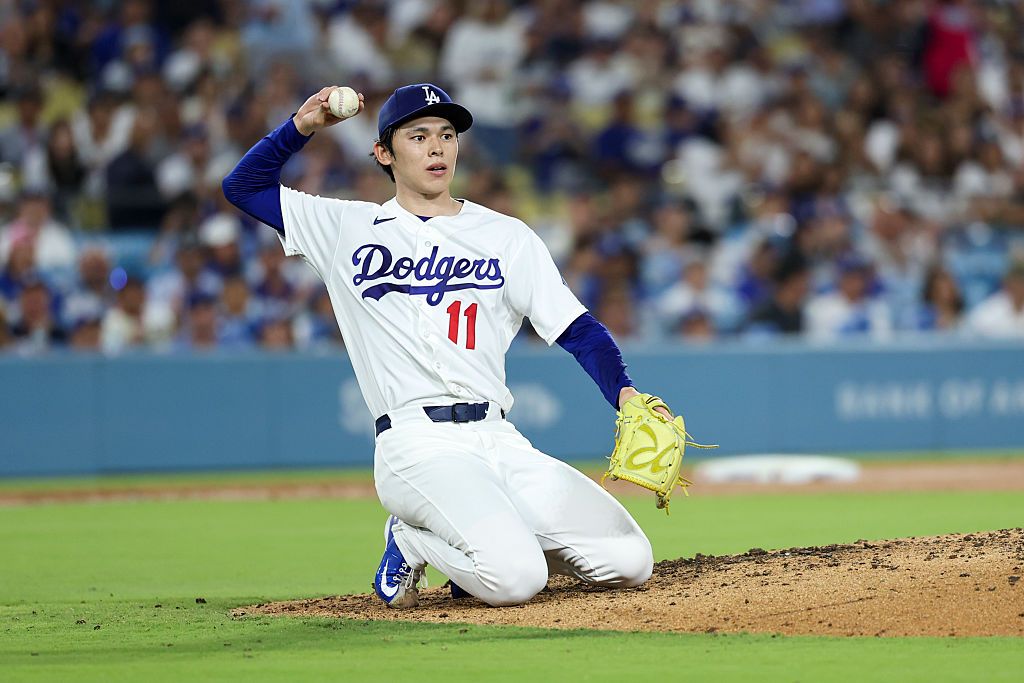
Looking for today’s Yankees vs. Dodgers betting splits? Below you’ll find the latest DraftKings Sportsbook betting percentages, Moneyline, Run Line and total splits, plus where the public is betting, where larger wagers may indicate sharp money, and key matchup stats before first pitch.
Yankees vs. Dodgers Odds
| Market | Side | Odds |
|---|---|---|
| Moneyline | NY Yankees | −108 |
| Moneyline | LA Dodgers | −111 |
| Run Line | NY Yankees +1.5 | −171 |
| Run Line | LA Dodgers -1.5 | +141 |
| Total | Over 9 | −118 |
| Total | Under 9 | −102 |
This is priced as a virtual pick’em with the Yankees as slight home favorites at −108. The 9-run total reflects the offensive upside of both lineups at Yankee Stadium, with the over carrying marginally more juice at −118.
DraftKings Betting Splits
| Market | Side | Handle % | Bets % |
|---|---|---|---|
| Moneyline | NY Yankees | 33% | 32% |
| Moneyline | LA Dodgers | 67% | 68% |
| Run Line | NY Yankees +1.5 | 19% | 51% |
| Run Line | LA Dodgers -1.5 | 81% | 49% |
| Total | Over 9 | 18% | 48% |
| Total | Under 9 | 82% | 52% |
Public Betting Trends
The Moneyline tells a straightforward story: 68% of tickets and 67% of handle are on the Dodgers. The near-perfect alignment between bets and money suggests the public and sharps are largely in agreement here, with LA drawing consistent action at −111. Despite this two-thirds lean toward the visitors, the line hasn’t moved off a coin-flip number, which indicates books are comfortable with their exposure.
The Run Line is where the real action diverges. Tickets are split almost evenly (51% Yankees +1.5, 49% Dodgers -1.5), but handle is wildly lopsided: 81% of the money sits on LA -1.5. That massive gap between 49% of bets and 81% of dollars points directly to high-limit or sharp wagers backing the Dodgers to win by 2 or more. At +141, that’s a significant statement of confidence from bigger bettors.
The total market mirrors the Run Line pattern in reverse. Tickets lean slightly under (52%), but handle is overwhelmingly under at 82%. Large bettors are hammering Under 9 despite the hitter-friendly venue and two potent offenses. This may reflect confidence in Cole’s recent form or skepticism about Sasaki’s ability to keep the Yankees quiet long enough for a high-scoring game to develop on both sides.
The combination of these splits paints a clear picture: sharp money likes the Dodgers to win convincingly and the game to stay under. The Moneyline being stuck at −111 despite 67% handle on LA suggests books see value in the Yankees at this number, creating a potential contrarian spot for those willing to fade the public.
Yankees vs. Dodgers Stats
Team Batting Stats
| Stat | NY Yankees | LA Dodgers |
|---|---|---|
| AVG | .237 | .262 |
| OBP | .317 | .343 |
| SLG | .424 | .434 |
| ISO | .187 | .172 |
| OPS | .741 | .777 |
| K% | 24.1% | 20.3% |
Starting Pitcher Stats
| Stat | Gerrit Cole (NYY) | Roki Sasaki (LAD) |
|---|---|---|
| Record | 3-4 | 3-5 |
| ERA | 4.04 | 5.33 |
| WHIP | 1.20 | 1.36 |
| FIP | 4.04 | 5.58 |
| xFIP | 4.08 | 4.33 |
| WAR | 0.73 | 0.13 |
| K% | 22.7% | 22.7% |
| BB% | 5.3% | 9.4% |
| HR/9 | 1.47 | 2.11 |
Key Matchup Numbers
- Pitching Edge: Cole owns a full run advantage in ERA (4.04 vs. 5.33), walks fewer batters (5.3% vs. 9.4% BB%), and surrenders fewer home runs (1.47 vs. 2.11 HR/9). His FIP (4.04) aligns with his surface numbers, while Sasaki’s 5.58 FIP suggests his struggles are real, not unlucky.
- Offensive Edge: The Dodgers lead in AVG (.262 vs. .237), OBP (.343 vs. .317), and OPS (.777 vs. .741). New York counters with superior raw power (ISO .187 vs. .172), but strikes out far more often (24.1% vs. 20.3%).
- Home Splits: Cody Bellinger (1.013 OPS, 8 HR) and Ben Rice (.985 OPS, 15 HR) have mashed at Yankee Stadium. On the road, Freddie Freeman (1.024 OPS), Tommy Edman (1.009 OPS), and Shohei Ohtani (.968 OPS, 9 HR) are all producing at elite levels for Los Angeles.
- Momentum: New York has won 4 straight and gone 6-4 in the last 10. Los Angeles has dropped 3 consecutive games and sits at 5-5 over the last 10, their first real cold stretch of the season despite holding the best record in baseball at 61-36.
- Injury Impact: The Yankees are without Aaron Judge (rib, D10), Giancarlo Stanton (leg, D10), Max Fried (elbow, D15), and Carlos Rodon (elbow, D15). LA is missing Glasnow, Snell, Stone, and Miller from the rotation, leaving Sasaki as one of the few healthy options despite his struggles.
Cole holds a clear edge over Sasaki in every pitching metric that matters, and the Yankees’ power-first approach at home could exploit Sasaki’s 2.11 HR/9. However, the Dodgers’ superior plate discipline and contact ability present a difficult matchup for a Cole who has been far more hittable (4.04 ERA) than his career norms, and LA’s road dominance (30-17) dwarfs New York’s modest 23-20 home mark.
Betting Splits Summary
| Category | Edge |
|---|---|
| Public Betting (ML) | LA Dodgers (68% bets) |
| Money Handle (ML) | LA Dodgers (67%) |
| Run Line Handle | LA Dodgers -1.5 (81%) |
| Total Handle | Under 9 (82%) |
| Biggest Split | Under 9 handle: 82% vs. 52% tickets |
FAQs
What are MLB betting splits?
MLB betting splits show the percentage of bets (tickets) and money (handle) on each side of a market. They help identify which side the general public favors and where sharper bettors may be positioned.
What is the difference between bets and handle?
Bets refer to the number of individual wagers placed, while handle is the total dollar amount wagered. A gap between the two can indicate that larger, often sharper, bettors are on one side while the general public favors the other.
What is sharp money?
Sharp money refers to wagers placed by professional or highly informed bettors. It’s often identified when the handle percentage significantly exceeds the bet percentage on a given side, or when line movement contradicts public betting trends.
Should you follow betting splits?
Betting splits are one tool among many. They work best as confirmation alongside your own analysis. Following handle over ticket count tends to be more informative, and splits are most useful when combined with line movement data.
How often do DraftKings betting splits update?
DraftKings betting splits update approximately every two minutes, giving you a near-real-time look at how public money and ticket counts are shifting as the game approaches.