

Looking for today’s Mariners vs. Giants betting splits? Below you’ll find the latest DraftKings Sportsbook betting percentages, Moneyline, Run Line and total splits, plus where the public is betting, where larger wagers may indicate sharp money, and key matchup stats before first pitch.
Mariners vs. Giants Odds
| Market | Side | Odds |
|---|---|---|
| Moneyline | SEA Mariners | −198 |
| Moneyline | SF Giants | +163 |
| Run Line | SEA Mariners -1.5 | +123 |
| Run Line | SF Giants +1.5 | −149 |
| Total | Over 7 | −122 |
| Total | Under 7 | +102 |
Seattle is a heavy home favorite at −198, implying roughly 66% win probability. The O/U 7 is the lowest total on the entire Friday slate, juiced heavily to the over at −122, reflecting T-Mobile Park’s pitcher-friendly dimensions and Bryce Miller’s dominant form. The Run Line is competitive: Mariners -1.5 at +123 offers plus-money on a team expected to win comfortably.
DraftKings Betting Splits
| Market | Side | Handle % | Bets % |
|---|---|---|---|
| Moneyline | SEA Mariners | 82% | 91% |
| Moneyline | SF Giants | 18% | 9% |
| Run Line | SEA Mariners -1.5 | 79% | 48% |
| Run Line | SF Giants +1.5 | 21% | 53% |
| Total | Over 7 | 88% | 62% |
| Total | Under 7 | 12% | 38% |
Public Betting Trends
The Moneyline is an unusual case where the public is actually more aggressive than the money. A massive 91% of tickets are on Seattle, but only 82% of handle has followed. That 9-point gap in the opposite direction (tickets exceeding handle) tells us that while the general public is piling on the Mariners at −198, some larger bettors are finding value on San Francisco at +163. This is a classic “steam” scenario where the public is so heavy on the favorite that contrarian sharp money quietly accumulates on the underdog.
The Run Line reinforces the sharp lean toward Seattle’s margin of victory. While tickets are nearly split (48% Mariners -1.5 / 53% Giants +1.5), handle is 79% on Seattle -1.5 at +123. Large bettors aren’t just backing the Mariners to win; they’re confident Miller’s dominance translates to a multi-run cushion. The plus-money price on a −198 Moneyline favorite to cover -1.5 is attracting significant dollars.
The total follows the same pattern of sharp aggression. With 62% of tickets on Over 7, the handle concentration is even heavier at 88%. Despite the lowest total on the board and over juice at −122, big-money bettors are loading up on the over. This may seem counterintuitive against Miller’s 2.19 ERA, but Roupp’s 10.2% walk rate means baserunners, and San Francisco’s .730 OPS (.420 SLG) suggests enough offensive firepower to contribute even against elite arms. The read may be that 7 is simply too low given both offenses will get opportunities.
Mariners vs. Giants Stats
Team Batting Stats
| Stat | SEA Mariners | SF Giants |
|---|---|---|
| AVG | .230 | .256 |
| OBP | .310 | .310 |
| SLG | .380 | .420 |
| ISO | .150 | .164 |
| OPS | .690 | .730 |
| K% | 23.2% | 20.6% |
Starting Pitcher Stats
| Stat | Bryce Miller (SEA) | Landen Roupp (SF) |
|---|---|---|
| Record | 4-3 | 6-8 |
| ERA | 2.19 | 4.27 |
| WHIP | 0.83 | 1.31 |
| FIP | 3.12 | 3.28 |
| xFIP | 3.01 | 3.67 |
| WAR | 1.34 | 2.06 |
| K% | 30.2% | 25.3% |
| BB% | 3.7% | 10.2% |
| HR/9 | 1.25 | 0.65 |
Key Matchup Numbers
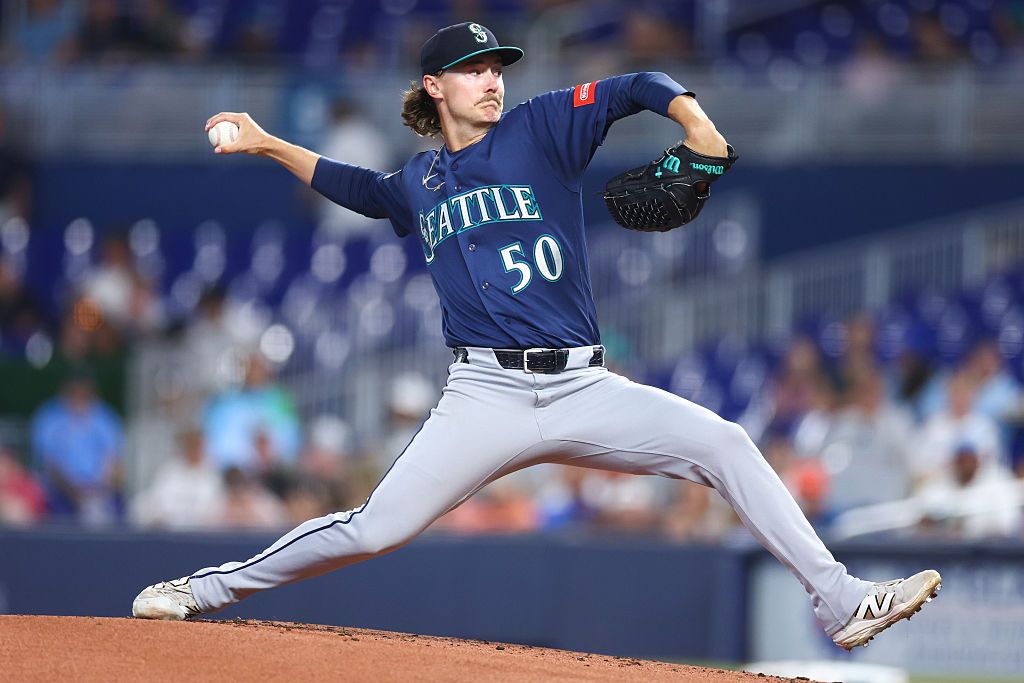
- Miller’s Dominance: Bryce Miller has been elite across 9 starts: a 2.19 ERA, 0.83 WHIP, 30.2% K rate, and a minuscule 3.7% walk rate. His command is near-perfect, allowing him to attack hitters relentlessly. His 3.12 FIP confirms the performance is largely sustainable, not luck-driven.
- Roupp’s Paradox: Roupp owns a 2.06 WAR that exceeds Miller’s (1.34) despite a mediocre 4.27 ERA and 1.31 WHIP. The disconnect comes from his 3.28 FIP, 25.3% K rate, and exceptional 0.65 HR/9. His 10.2% walk rate inflates ERA but doesn’t lead to home runs, making him better than his surface numbers suggest. The volume advantage (18 starts vs. 9) explains the WAR gap.
- Offensive Mismatch: San Francisco’s .730 OPS significantly outpaces Seattle’s .690, with edges in average (.256 vs. .230), slugging (.420 vs. .380), and ISO (.164 vs. .150). The Giants also strike out less (20.6% vs. 23.2%), which matters against a pitcher like Miller who lives on punchouts.
- Seattle at Home: The Mariners are 27-20 at home, their only winning split this season (21-29 road). Dominic Canzone (1.016 OPS, 9 HR at home) and Julio Rodriguez (.815 OPS, 9 HR) anchor the home offense. However, Rodriguez is on the D7 IL with a head injury, which is a significant blow to Seattle’s lineup depth.
- Giants’ Road Struggles: San Francisco is 19-30 on the road, one of the worst road marks in baseball. Casey Schmitt (.862 OPS, 10 HR on the road) and Rafael Devers (.827 OPS, 9 HR) provide power, but key road bats Cox, Bericoto, and Chapman are all on the injured list, limiting their ability to challenge Miller.
Miller’s dominance (2.19 ERA, 0.83 WHIP, 30.2% K) at T-Mobile Park against a depleted Giants road lineup (19-30, missing Chapman, Bader, Cox) is the clear driver behind the −198 price. But the market is not entirely one-sided: the 82% ML handle falling short of 91% tickets suggests some sharp bettors see value on San Francisco at +163, likely banking on Roupp’s elite FIP (3.28) and HR-suppression (0.65 HR/9) keeping the game close. The 88% over handle reflects confidence that even in a pitcher-friendly park, a total of 7 is too low when Roupp’s walks put runners on, and Seattle’s home bats can capitalize on mistakes.
Betting Splits Summary
| Category | Edge |
|---|---|
| Public Betting (ML) | SEA Mariners (91% bets) |
| Money Handle (ML) | SEA Mariners (82%) |
| Run Line Handle | SEA Mariners -1.5 (79%) |
| Total Handle | Over 7 (88%) |
| Biggest Split | Run Line handle: 79% SEA vs. 48% tickets |
FAQs
What are MLB betting splits?
MLB betting splits show the percentage of bets (tickets) and money (handle) on each side of a market. They help identify which side the general public favors and where sharper bettors may be positioned.
What is the difference between bets and handle?
Bets refer to the number of individual wagers placed, while handle is the total dollar amount wagered. A gap between the two can indicate that larger, often sharper, bettors are on one side while the general public favors the other.
What is sharp money?
Sharp money refers to wagers placed by professional or highly informed bettors. It’s often identified when the handle percentage significantly exceeds the bet percentage on a given side, or when line movement contradicts public betting trends.
Should you follow betting splits?
Betting splits are one tool among many. They work best as confirmation alongside your own analysis. Following handle over ticket count tends to be more informative, and splits are most useful when combined with line movement data.
How often do DraftKings betting splits update?
DraftKings betting splits update approximately every two minutes, giving you a near-real-time look at how public money and ticket counts are shifting as the game approaches.