

Looking for today’s Blue Jays vs. White Sox betting splits? Below you’ll find the latest DraftKings Sportsbook betting percentages, Moneyline, Run Line and total splits, plus where the public is betting, where larger wagers may indicate sharp money, and key matchup stats before first pitch.
Blue Jays vs. White Sox Odds
| Market | Side | Odds |
|---|---|---|
| Moneyline | TOR Blue Jays | −136 |
| Moneyline | CHI White Sox | +113 |
| Run Line | TOR Blue Jays -1.5 | +153 |
| Run Line | CHI White Sox +1.5 | −187 |
| Total | Over 8.5 | −112 |
| Total | Under 8.5 | −108 |
Toronto is a moderate home favorite at −136, implying about 58% win probability. The total is set at O/U 8.5, slightly juiced to the over at −112, indicating the market leans toward offense at Rogers Centre.
DraftKings Betting Splits
| Market | Side | Handle % | Bets % |
|---|---|---|---|
| Moneyline | TOR Blue Jays | 65% | 62% |
| Moneyline | CHI White Sox | 35% | 38% |
| Run Line | TOR Blue Jays -1.5 | 87% | 31% |
| Run Line | CHI White Sox +1.5 | 13% | 69% |
| Total | Over 8.5 | 43% | 50% |
| Total | Under 8.5 | 57% | 50% |
Public Betting Trends
The Moneyline action is relatively balanced. Toronto is drawing 62% of tickets and 65% of handle, a proportional split that suggests neither side has a clear sharp-versus-public divergence. The line sitting steady at −136 with this volume distribution indicates the market is comfortable with its pricing.
The Run Line reveals a sharp-money signal. While 69% of tickets are on Chicago +1.5 (the public grabbing the points with the underdog), a massive 87% of the handle sits on Toronto -1.5. That 56-point gap between ticket percentage (31%) and handle (87%) on the Blue Jays Run Line is one of the largest on the board, pointing to high-limit bettors confident Toronto wins by 2 or more at +153.
The total is the most evenly split market. Tickets are dead even at 50/50, while handle leans slightly under at 57%. With the juice favoring the over (−112 vs. −108), the mild under handle lean suggests some informed bettors see value fading the 8.5 in what could be a pitcher-driven game despite the Rogers Centre environment.
Blue Jays vs. White Sox Stats
Team Batting Stats
| Stat | TOR Blue Jays | CHI White Sox |
|---|---|---|
| AVG | .244 | .241 |
| OBP | .306 | .319 |
| SLG | .384 | .413 |
| ISO | .140 | .172 |
| OPS | .690 | .732 |
| K% | 19.6% | 23.7% |
Starting Pitcher Stats
| Stat | Spencer Miles (TOR) | Anthony Kay (CWS) |
|---|---|---|
| Record | 4-1 | 6-4 |
| ERA | 2.85 | 4.23 |
| WHIP | 1.10 | 1.38 |
| FIP | 3.02 | 4.97 |
| xFIP | 3.25 | 4.85 |
| WAR | 0.94 | 0.62 |
| K% | 23.5% | 17.6% |
| BB% | 7.8% | 8.7% |
| HR/9 | 0.60 | 1.21 |
Key Matchup Numbers
- Pitching Edge: Miles has been excellent in a small sample (3 starts), posting a 2.85 ERA with a 3.02 FIP that backs up the results and a stingy 0.60 HR/9. Kay’s 4.23 ERA is propped up by a 4.97 FIP and 4.85 xFIP that scream trouble, with a 17.6% K rate that offers little margin for error.
- Offensive Surprise: Chicago actually holds the offensive edge here: .732 OPS versus Toronto’s .690, with more power (ISO .172 vs. .140) and better on-base ability (.319 vs. .306). The White Sox, first in the AL Central at 50-45, are not the rebuilding club many bettors may remember.
- Home/Road Split: Chicago has been dominant at home (31-17) but struggles significantly on the road at 19-28. Toronto is 24-25 at Rogers Centre, making this a neutral-at-best home-field advantage rather than a true edge for the Blue Jays.
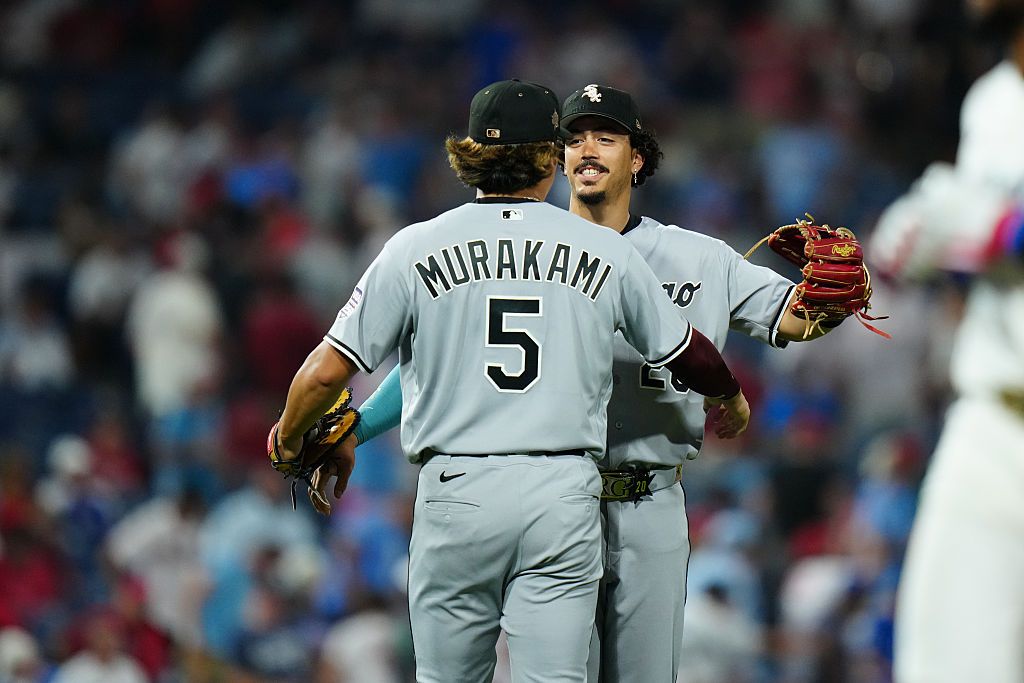
- Road Power: Munetaka Murakami leads White Sox road bats with a .973 OPS and 10 home runs. Toronto’s home leaders include Kazuma Okamoto (.816 OPS, 10 HR) and Ernie Clement (.819 OPS), though Okamoto’s power output matches Murakami’s.
- Roster Context: Toronto is without Berrios, Scherzer, and Francis from the rotation plus Anthony Santander (D60) from the lineup. Chicago has lost Drew Thorpe and Ky Bush from the rotation, leaving Kay as a back-end option whose peripherals are concerning.
The market prices Toronto as a −136 favorite primarily on Miles’s pitching edge, but Chicago’s superior offense and the White Sox’s first-place standing make this a closer game than the line suggests. The 87% Run Line handle on Toronto -1.5 signals sharp confidence in a blowout, likely driven by the Miles-Kay mismatch, though Chicago’s road struggles (19-28) partially undercut their offensive numbers in this context.
Betting Splits Summary
| Category | Edge |
|---|---|
| Public Betting (ML) | TOR Blue Jays (62% bets) |
| Money Handle (ML) | TOR Blue Jays (65%) |
| Run Line Handle | TOR Blue Jays -1.5 (87%) |
| Total Handle | Under 8.5 (57%) |
| Biggest Split | Run Line handle: 87% TOR vs. 31% tickets |
FAQs
What are MLB betting splits?
MLB betting splits show the percentage of bets (tickets) and money (handle) on each side of a market. They help identify which side the general public favors and where sharper bettors may be positioned.
What is the difference between bets and handle?
Bets refer to the number of individual wagers placed, while handle is the total dollar amount wagered. A gap between the two can indicate that larger, often sharper, bettors are on one side while the general public favors the other.
What is sharp money?
Sharp money refers to wagers placed by professional or highly informed bettors. It’s often identified when the handle percentage significantly exceeds the bet percentage on a given side, or when line movement contradicts public betting trends.
Should you follow betting splits?
Betting splits are one tool among many. They work best as confirmation alongside your own analysis. Following handle over ticket count tends to be more informative, and splits are most useful when combined with line movement data.
How often do DraftKings betting splits update?
DraftKings betting splits update approximately every two minutes, giving you a near-real-time look at how public money and ticket counts are shifting as the game approaches.