

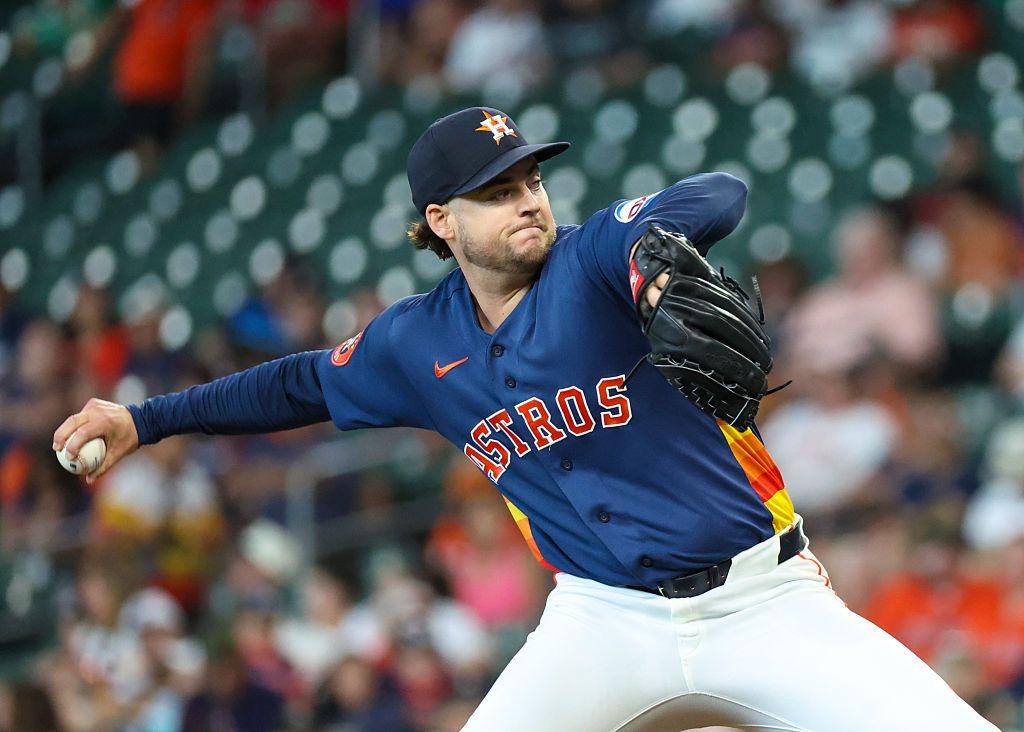
Looking for today’s Astros vs. Orioles betting splits? Below you’ll find the latest DraftKings Sportsbook betting percentages, Moneyline, Run Line and total splits, plus where the public is betting, where larger wagers may indicate sharp money, and key matchup stats before first pitch.
Astros vs. Orioles Odds
| Market | Side | Odds |
|---|---|---|
| Moneyline | HOU Astros | −117 |
| Moneyline | BAL Orioles | −103 |
| Run Line | HOU Astros +1.5 | −192 |
| Run Line | BAL Orioles -1.5 | +158 |
| Total | Over 8.5 | −122 |
| Total | Under 8.5 | +101 |
Houston is a slight home favorite at −117 in what’s essentially a pick’em. The O/U 8.5 is juiced heavily to the over at −122, signaling the market expects offense from both sides at Daikin Park.
DraftKings Betting Splits
| Market | Side | Handle % | Bets % |
|---|---|---|---|
| Moneyline | HOU Astros | 84% | 62% |
| Moneyline | BAL Orioles | 16% | 38% |
| Run Line | HOU Astros +1.5 | 40% | 83% |
| Run Line | BAL Orioles -1.5 | 60% | 17% |
| Total | Over 8.5 | 98% | 67% |
| Total | Under 8.5 | 2% | 33% |
Public Betting Trends
The Moneyline shows strong sharp alignment with Houston: 62% of tickets and 84% of handle are on the Astros. The 22-point gap between ticket and handle percentage suggests large bettors are more confident in Houston than the general public, a bullish indicator for the home side. At −117, they’re getting a near-pick’em price on the favorite with significant money flow supporting that position.
The Run Line presents a contradictory wrinkle. While 83% of tickets sit on Houston +1.5 (the public hedging with the home favorite), 60% of the handle is on Baltimore -1.5. Larger bettors are backing the Orioles to win by 2 or more at +158, even as the Moneyline money pours in on Houston. This suggests a subset of informed bettors see a scenario where, if Baltimore wins, they win convincingly.
The total is the most extreme split: 98% of handle on Over 8.5, vastly outpacing the 67% ticket lean. The already-juiced over (−122) isn’t scaring anyone away. With both starters carrying underlying vulnerabilities (Lambert’s 4.24 FIP, Kremer’s 3.68 HR/9), the sharp community is emphatic that this game produces runs.
Astros vs. Orioles Stats
Team Batting Stats
| Stat | HOU Astros | BAL Orioles |
|---|---|---|
| AVG | .242 | .239 |
| OBP | .315 | .321 |
| SLG | .413 | .401 |
| ISO | .171 | .162 |
| OPS | .728 | .722 |
| K% | 21.6% | 24.0% |
Starting Pitcher Stats
| Stat | Peter Lambert (HOU) | Dean Kremer (BAL) |
|---|---|---|
| Record | 8-5 | 1-2 |
| ERA | 3.14 | 4.09 |
| WHIP | 1.12 | 1.00 |
| FIP | 4.24 | 6.78 |
| xFIP | 4.48 | 3.35 |
| WAR | 1.11 | −0.32 |
| K% | 22.9% | 27.9% |
| BB% | 9.3% | 4.7% |
| HR/9 | 1.15 | 3.68 |
Key Matchup Numbers
- Pitching Contrast: Lambert’s 3.14 ERA looks strong, but his 4.24 FIP and 4.48 xFIP suggest he’s been fortunate. Kremer is the opposite extreme: a 1.00 WHIP and 27.9% K rate suggest dominance, but his 6.78 FIP and 3.68 HR/9 in just 4 starts indicate the home runs are devastating his value. His 3.35 xFIP hints the HR rate will normalize, but it hasn’t yet.
- Yordan Alvarez at Home: Alvarez is producing a monster 1.171 OPS with 16 home runs at Daikin Park. Against a pitcher giving up 3.68 HR/9, this matchup is the primary engine behind the over play and Houston’s Moneyline support. Jeremy Pena (.940 OPS at home) and Jose Altuve (.810 OPS) add depth.
- Offensive Similarity: Both teams post nearly identical OPS numbers (.728 vs. .722). Houston has more raw power (ISO .171 vs. .162) while Baltimore gets on base slightly more (.321 vs. .315 OBP). Neither offense is elite, but both are functional.
- Baltimore’s Road Woes: The Orioles are just 18-26 on the road despite winning 4 straight. Their top road bat, Pete Alonso (.832 OPS, 9 HR), provides power, but the team collectively struggles away from Camden Yards.
- Injury Toll: Houston is without Correa (ankle, D60) and Blanco (elbow, D60) from the rotation. Baltimore’s losses are more severe: Westburg (UCL, D60), Mountcastle (foot, D60), Eflin, Bassitt, and closer Helsley all sidelined, gutting their roster depth on both sides of the ball.
The 98% over handle reflects the collision of Kremer’s extreme 3.68 HR/9 with Alvarez’s elite home power. Lambert’s outperformance of his peripherals (3.14 ERA vs. 4.24 FIP) may not hold against an Orioles team with road power in Alonso and Ward, but the Houston lineup’s ability to punish Kremer’s home run problem at a hitter-friendly venue is what the market is pricing in most aggressively. The contradictory Run Line split (60% handle on BAL -1.5 vs. 84% ML handle on Houston) suggests sharp disagreement on outcome, but near-consensus that this game produces runs regardless of winner.
Betting Splits Summary
| Category | Edge |
|---|---|
| Public Betting (ML) | HOU Astros (62% bets) |
| Money Handle (ML) | HOU Astros (84%) |
| Run Line Handle | BAL Orioles -1.5 (60%) |
| Total Handle | Over 8.5 (98%) |
| Biggest Split | Total handle: 98% Over vs. 67% tickets |
FAQs
What are MLB betting splits?
MLB betting splits show the percentage of bets (tickets) and money (handle) on each side of a market. They help identify which side the general public favors and where sharper bettors may be positioned.
What is the difference between bets and handle?
Bets refer to the number of individual wagers placed, while handle is the total dollar amount wagered. A gap between the two can indicate that larger, often sharper, bettors are on one side while the general public favors the other.
What is sharp money?
Sharp money refers to wagers placed by professional or highly informed bettors. It’s often identified when the handle percentage significantly exceeds the bet percentage on a given side, or when line movement contradicts public betting trends.
Should you follow betting splits?
Betting splits are one tool among many. They work best as confirmation alongside your own analysis. Following handle over ticket count tends to be more informative, and splits are most useful when combined with line movement data.
How often do DraftKings betting splits update?
DraftKings betting splits update approximately every two minutes, giving you a near-real-time look at how public money and ticket counts are shifting as the game approaches.