

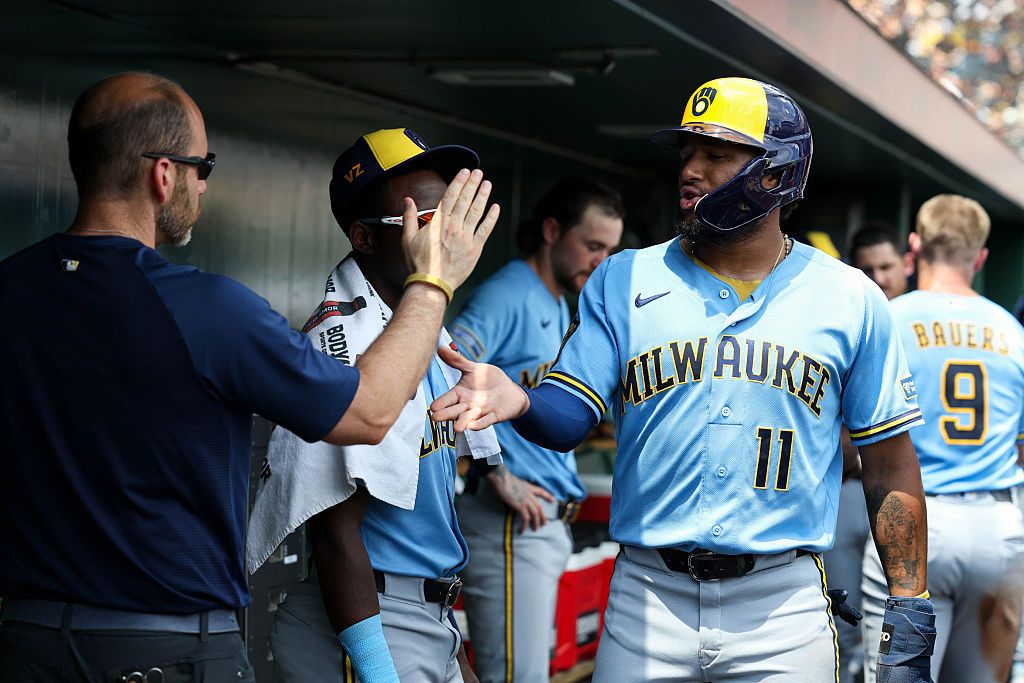
Looking for today’s Milwaukee Brewers vs. New York Mets betting splits? Below you’ll find the latest DraftKings Sportsbook betting percentages, including Moneyline, Run Line and total splits, plus where the public is betting, where larger wagers may indicate sharp money, and key matchup stats before first pitch.
Brewers vs. Mets Odds
| Market | Brewers | Mets |
|---|---|---|
| Moneyline | -149 | +123 |
| Run Line | -1.5 (+138) | +1.5 (-167) |
| Total | O/U 9 (Over +100 / Under -120) | |
DraftKings Betting Splits
| Market | Side | Handle % | Bets % |
|---|---|---|---|
| Moneyline | MIL Brewers | 34% | 85% |
| Moneyline | NY Mets | 66% | 15% |
| Run Line | MIL Brewers -1.5 | 48% | 57% |
| Run Line | NY Mets +1.5 | 52% | 43% |
| Total | Over 9 | 83% | 32% |
| Total | Under 9 | 17% | 68% |
Public Betting Trends
The Moneyline split tells an interesting story in this one. A massive 85% of bets are landing on Milwaukee at -149, yet only 34% of the handle backs the Brewers. That means the Mets are drawing just 15% of tickets but account for 66% of the money wagered. This is a classic reverse-line-movement indicator where larger, potentially sharper wagers are concentrated on the underdog.
On the Run Line, the Brewers -1.5 hold a modest edge in ticket count at 57% to 43%, but the handle is nearly split at 48/52, with a slight lean toward the Mets +1.5. The public likes Milwaukee to cover, but the bigger bettors are hedging toward the points with New York.
The total market shows a heavy Under lean by ticket count at 68% versus 32% for the Over. However, the handle paints the opposite picture: 83% of the money is on the Over 9. This is another sharp-versus-public divergence where recreational bettors are fading offense while larger wagers are backing the Over at even money.
Brewers vs. Mets Stats
Team Batting Stats
| Stat | Brewers | Mets |
|---|---|---|
| AVG | .253 | .233 |
| OBP | .337 | .303 |
| SLG | .399 | .380 |
| OPS | .736 | .683 |
| ISO | .146 | .147 |
| BABIP | .307 | .274 |
| K% | 21.2% | 22.1% |
| BB% | 10.3% | 8.2% |
| Runs | 510 | 412 |
Team Pitching Stats
| Stat | Brewers | Mets |
|---|---|---|
| ERA | 3.44 | 4.27 |
| WHIP | 1.157 | 1.311 |
| K/9 | 9.80 | 9.26 |
| K/BB | 3.09 | 2.55 |
| OBA | .218 | .238 |
Starting Pitcher Stats
| Stat | Brandon Sproat (MIL) | Zach Thornton (NYM) |
|---|---|---|
| Record | 3-4 | 0-1 |
| ERA | 5.16 | 2.60 |
| WHIP | 1.366 | 0.923 |
| FIP | 5.12 | 2.99 |
| xFIP | 4.26 | 3.93 |
| K/9 | 9.55 | 7.79 |
| HR/9 | 1.65 | 0.52 |
| K% | 24.7% | 22.4% |
| BB% | 11.1% | 7.5% |
| Starts | 16 | 3 |
| QS | 3 | 2 |
Key Matchup Numbers
- NL record disparity: Milwaukee owns the best record in the National League at 63-37 and leads the NL Central by a comfortable margin. The Mets sit fifth in the NL East at 42-59, 17 games back.
- Milwaukee’s home dominance: The Brewers are on a four-game winning streak and sport a 33-18 home record. The Mets are 21-31 on the road this season.
- Pitching matchup contrast: Sproat has struggled with a 5.16 ERA and 1.37 WHIP across 16 starts, producing only 3 quality starts. Thornton carries a sparkling 2.60 ERA and 0.92 WHIP but has made just 3 starts at the major-league level.
- Brewers’ plate discipline edge: Milwaukee’s lineup holds a significant edge in plate discipline 10.3% walk rate and .337 OBP compared to the Mets’ 8.2% walk rate and .303 OBP.
- Brewers’ home split stars: At home, the Brewers feature Jackson Chourio (.273 AVG, .872 OPS, 8 HR), Garrett Mitchell (.309 AVG, .894 OPS), and Brice Turang (.284 AVG, .868 OPS) as their top split performers.
Despite the lopsided team records and Milwaukee’s home dominance, the pitching matchup favors the visitors. Thornton’s elite peripherals and low walk rate could suppress a Brewers lineup that may be vulnerable against an unfamiliar arm, while Sproat’s homer-prone tendencies keep the Mets in the game offensively.
Betting Splits Summary
| Category | Edge |
|---|---|
| Moneyline Handle | Mets (66% of money on +123) |
| Moneyline Bets | Brewers (85% of tickets) |
| Run Line Handle | Mets +1.5 (52%) |
| Run Line Bets | Brewers -1.5 (57%) |
| Total Handle | Over 9 (83%) |
| Total Bets | Under 9 (68%) |
| Sharp Indicator | Mets Moneyline, Over 9 |
FAQs
What are MLB betting splits?
Betting splits show how the public is wagering on a game by breaking down the percentage of total bets (tickets) and total money (handle) on each side of a market. They help identify which side recreational bettors favor versus where larger, potentially sharper money is landing.
What is the difference between bets and handle?
Bets refer to the number of individual tickets placed, while handle represents the total dollar amount wagered. A side with low bet percentage but high handle percentage suggests fewer bettors placing larger wagers, often interpreted as sharp or professional action.
How do betting splits identify sharp money?
Sharp money refers to wagers placed by professional or highly informed bettors. It is typically identified through handle-vs-bet discrepancies: when a side draws a disproportionate share of money relative to its ticket count, sharps are likely involved.
Should you follow betting splits?
Splits are one tool among many. They are most useful when a clear divergence exists between public tickets and money handle, suggesting professional disagreement with the recreational consensus. They work best combined with line movement analysis and matchup context.
How often do DraftKings betting splits update?
DraftKings betting splits update approximately every two minutes, providing near real-time insight into how the market is moving as game time approaches.
What is the best bet for Brewers vs. Mets?
The sharpest action by handle percentage is on New York Mets Moneyline at +123, with 66% of dollars backing that side on just 15% of bets. The Over 9 also draws heavy sharp interest at 83% of handle. Bettors looking for value may consider the Mets Moneyline given the significant divergence between handle and ticket count.
