

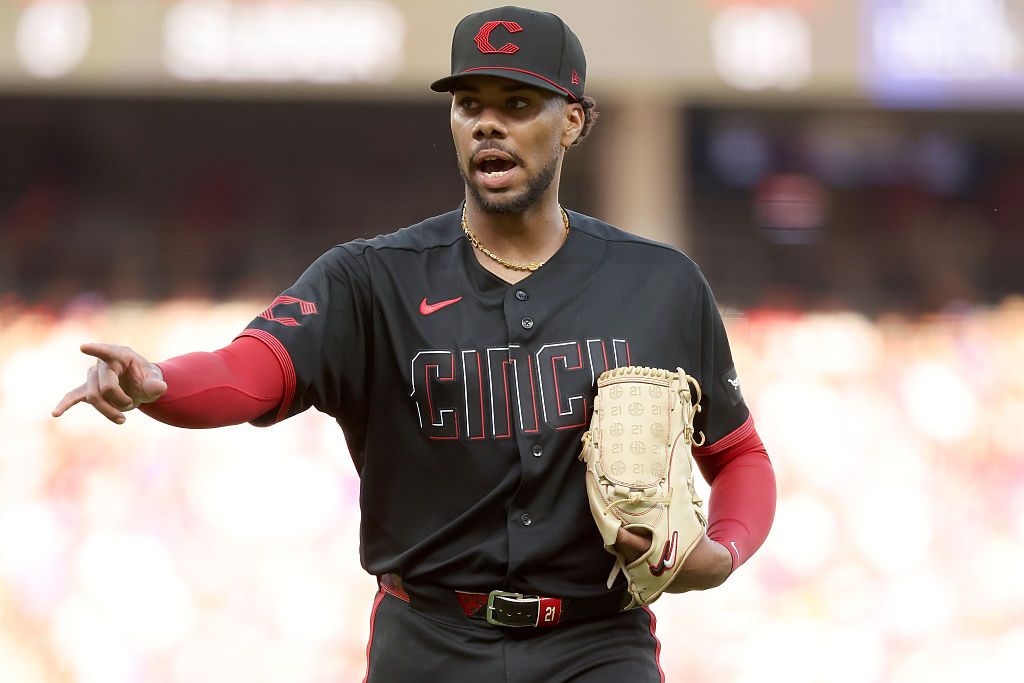
Looking for today’s Colorado Rockies vs. Cincinnati Reds betting splits? Below you’ll find the latest DraftKings Sportsbook betting percentages, including Moneyline, Run Line and total splits, plus where the public is betting, where larger wagers may indicate sharp money, and key matchup stats before first pitch.
Colorado Rockies vs. Cincinnati Reds Odds
| Market | Colorado Rockies | Cincinnati Reds |
|---|---|---|
| Moneyline | +141 | −171 |
| Run Line | +1.5 (−110) | −1.5 (−110) |
| Total | O/U 11 (Over −112 / Under −108) | |
DraftKings Betting Splits
| Market | Side | Bets % | Handle % |
|---|---|---|---|
| Moneyline | Colorado Rockies | 16% | 26% |
| Moneyline | Cincinnati Reds | 84% | 74% |
| Run Line | CIN Reds −1.5 | 53% | 96% |
| Run Line | COL Rockies +1.5 | 47% | 4% |
| Total | Over 11 | 43% | 79% |
| Total | Under 11 | 57% | 21% |
Public Betting Trends
Cincinnati draws 84% of Moneyline bets as the road favorite at −171, with 74% of the handle supporting that position. The 10-point gap between Colorado’s bet percentage (16%) and handle percentage (26%) shows a modest contrarian lean from larger bettors toward the home underdog at Coors Field, but it is not pronounced enough to constitute a sharp signal. The money largely follows the public here.
The Run Line reveals sharper conviction. Cincinnati −1.5 draws 53% of bets but 96% of the handle. That 43-point gap is significant, indicating that larger wagers are not just backing the Reds to win, but backing them to win by multiple runs at −110. Given the Coors Field environment and the total posted at 11, a multi-run Reds win is a logical expression of confidence in the pitching gap.
The total splits show the Under drawing 57% of bets but only 21% of the handle, while the Over 11 commands 79% of the money on just 43% of tickets. At Coors Field in 93-degree heat with two vulnerable starters (Greene’s 6.97 ERA, Feltner’s 4.55 ERA), the money is hammering Over despite the already-elevated number. The 36-point handle-to-bet gap on the Over confirms larger bettors expect a shootout.
Colorado Rockies vs. Cincinnati Reds Stats
Team Batting Stats
| Stat | Colorado Rockies | Cincinnati Reds |
|---|---|---|
| AVG | .255 | .231 |
| OBP | .326 | .310 |
| SLG | .420 | .398 |
| ISO | .165 | .167 |
| OPS | .746 | .708 |
| K% | 22.8% | 24.9% |
Starting Pitcher Stats
| Stat | Ryan Feltner (COL) | Hunter Greene (CIN) |
|---|---|---|
| Record | 3-3 | 1-1 |
| ERA | 4.55 | 6.97 |
| WHIP | 1.29 | 1.45 |
| FIP | 5.06 | 2.13 |
| xFIP | 4.62 | 1.92 |
| WAR | 0.52 | 0.42 |
| K% | 17.6% | 42.2% |
| BB% | 9.0% | 11.1% |
| HR/9 | 1.56 | 0.87 |
Key Matchup Numbers
- Greene’s extreme profile: Hunter Greene’s 6.97 ERA in 2 starts looks alarming, but his 2.13 FIP, 1.92 xFIP, and 42.2% strikeout rate tell a completely different story. He is striking out nearly half the batters he faces while allowing just 0.87 HR/9. The ERA is a product of a tiny sample size and sequencing, not stuff quality. He may be the most dangerous pitcher on the board relative to his surface numbers.
- Feltner lacks strikeouts: Ryan Feltner’s 17.6% K rate is among the lowest of any starter on the slate. At Coors Field in 93-degree heat, the inability to generate swings and misses against a Cincinnati lineup with .167 ISO and road power (Sal Stewart, 10 HR on the road) creates real blowup risk.
- Coors Field home production: Colorado’s home splits are strong: Mickey Moniak (1.043 OPS, 12 HR), Jake McCarthy (.943 OPS), and TJ Rumfield (.905 OPS) all hit significantly better at altitude. The Rockies’ .746 team OPS is inflated by home games but still represents legitimate run-scoring ability in this environment.
- Cincinnati’s road power: Sal Stewart leads the Reds with a .803 OPS and 10 home runs in 184 at-bats on the road. Tyler Stephenson (.822 OPS away) provides middle-of-the-order stability. At Coors Field, these numbers project to escalate.
- Run Line conviction: 96% of handle on CIN −1.5 at −110 reflects sharp confidence that Greene’s stuff (42% K rate) will dominate in a high-scoring game where the Reds outpace Colorado’s offense once Feltner’s limited K ability is exposed.
This game is a Coors Field special with a twist. The surface ERA favors Feltner (4.55 vs. 6.97), but the peripherals massively favor Greene. A 42.2% strikeout rate means Greene can pitch around his walks and BABIP issues by simply overpowering hitters, and his 0.87 HR/9 suggests even the altitude may not inflate his results as much as the market fears. Feltner’s 17.6% K rate leaves him with no margin for error in this environment, making him vulnerable to big innings from a Cincinnati lineup that has road power to spare. Colorado’s home-split bats keep them competitive (Moniak, McCarthy, Rumfield all produce at Coors), but the Rockies’ 5.42 team ERA and 1.51 WHIP from their staff means any deficit likely grows. The total at 11 and the Over handle at 79% reflect the expectation that both sides score, but Cincinnati wins the arms race.
Betting Splits Summary
| Category | Edge |
|---|---|
| Public Betting (Moneyline) | Cincinnati Reds (84% bets) |
| Money Handle (Moneyline) | Cincinnati Reds (74% handle) |
| Run Line Handle | CIN Reds −1.5 (96% handle) |
| Total Handle | Over 11 (79% handle) |
| Biggest Split | Run Line: 96% of handle on CIN −1.5 vs. 53% of bets |
FAQs
What are MLB betting splits?
MLB betting splits show the percentage of bets and money (handle) placed on each side of a market. They help bettors see where the public and sharper money are positioned before a game.
What is the difference between bets and handle?
Bets refer to the number of individual wagers placed, while handle refers to the total dollar amount wagered. A small number of large bets can move the handle significantly even when most tickets are on the other side.
What is sharp money?
Sharp money refers to wagers placed by professional or experienced bettors. It is often identified by a gap between bet percentage and handle percentage: when a side has more of the money than the tickets, larger (potentially sharper) bets are driving the action.
Should you follow betting splits?
Betting splits are one piece of the puzzle, not a standalone strategy. They are most useful when combined with line movement, matchup stats, and situational context. A large handle-to-bet discrepancy can highlight where professionals are positioned, but public money wins often enough that blindly fading it is not a guaranteed edge.
How often do DraftKings betting splits update?
DraftKings betting splits update approximately every two minutes, giving bettors a near real-time look at how the market is moving throughout the day.