

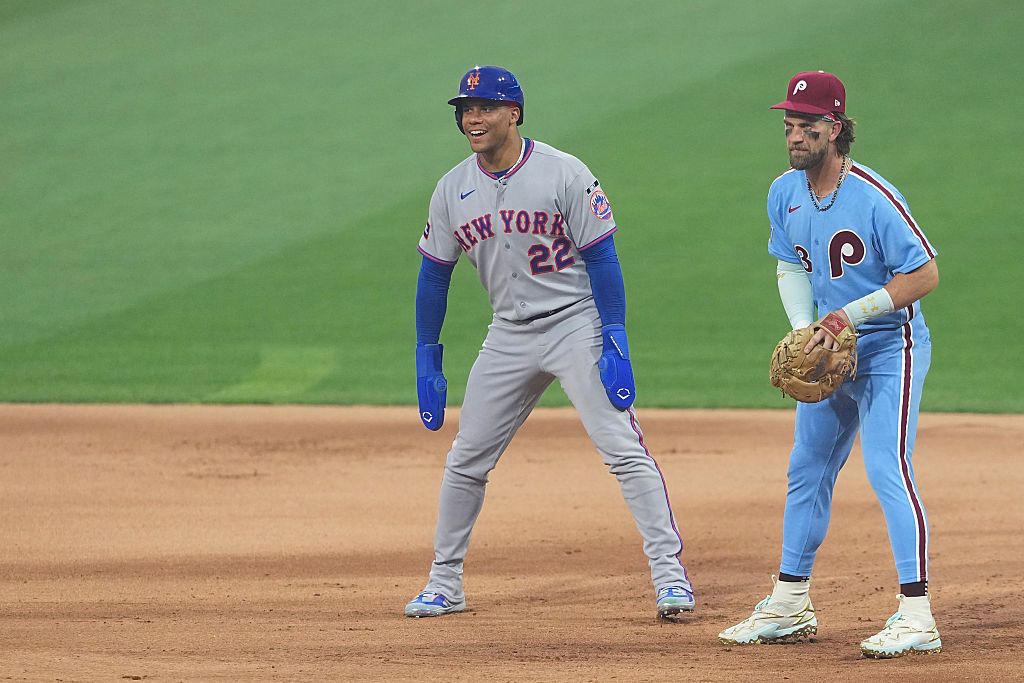
Looking for today’s Philadelphia Phillies vs. New York Mets betting splits? Below you’ll find the latest DraftKings Sportsbook betting percentages, including Moneyline, Run Line and total splits, plus where the public is betting, where larger wagers may indicate sharp money, and key matchup stats before first pitch.
Philadelphia Phillies vs. New York Mets Odds
| Market | Philadelphia Phillies | New York Mets |
|---|---|---|
| Moneyline | +109 | −131 |
| Run Line | +1.5 (−149) | −1.5 (+124) |
| Total | O/U 8.5 (Over −119 / Under −101) | |
DraftKings Betting Splits
| Market | Side | Bets % | Handle % |
|---|---|---|---|
| Moneyline | Philadelphia Phillies | 59% | 9% |
| Moneyline | New York Mets | 41% | 91% |
| Run Line | NY Mets −1.5 | 19% | 93% |
| Run Line | PHI Phillies +1.5 | 81% | 7% |
| Total | Over 8.5 | 44% | 58% |
| Total | Under 8.5 | 56% | 42% |
Public Betting Trends
Philadelphia is the public side in this NL East rivalry matchup, drawing 59% of Moneyline bets at the +109 home underdog price. But the handle tells a completely different story: 91% of the money is on New York at −131. That 50-point gap between bet percentage (41% on the Mets) and handle percentage (91%) is a textbook sharp money signal, with large wagers backing the road favorite against the ticket majority.
The Run Line amplifies the divergence. A commanding 81% of tickets are on Philadelphia +1.5, the natural comfort pick for bettors who like the home team but want insurance. Yet 93% of the handle is on NY Mets −1.5 at +124. Professional money is not just backing New York to win; they are backing them to win by multiple runs against a team 14 games above .500.
The total is the calmest market. The Under is drawing 56% of bets with 42% of the handle, while the Over has 44% of bets and 58% of the handle. The gap is modest compared to the Moneyline and Run Line, suggesting less conviction from sharps on the total direction. Both starters allow hard contact (Holmes’ 1.40 HR/9, Rangel’s small sample), but Nolan McLean’s 10.48 K/9 could suppress offense in the early innings.
The market is clearly pricing Nolan McLean’s pitching edge over Alan Rangel. Despite the Mets’ 41-58 record, sharp money sees this as a starter-driven spot where New York’s ace-caliber arm creates separation.
Philadelphia Phillies vs. New York Mets Stats
Team Batting Stats
| Stat | Philadelphia Phillies | New York Mets |
|---|---|---|
| AVG | .236 | .232 |
| OBP | .303 | .302 |
| SLG | .399 | .380 |
| ISO | .163 | .148 |
| OPS | .702 | .682 |
| K% | 23.5% | 22.0% |
Starting Pitcher Stats
| Stat | Alan Rangel (PHI) | Nolan McLean (NYM) |
|---|---|---|
| Record | 0-2 | 6-6 |
| ERA | 4.19 | 3.52 |
| WHIP | 1.40 | 1.12 |
| FIP | 4.39 | 3.44 |
| xFIP | 4.28 | 3.43 |
| WAR | 0.15 | 2.23 |
| K% | 25.9% | 27.9% |
| BB% | 10.6% | 8.7% |
| HR/9 | 1.40 | 0.84 |
Key Matchup Numbers
- Starter mismatch: Nolan McLean’s 3.44 FIP, 3.43 xFIP, and 2.23 WAR through 19 starts represent true ace production. Alan Rangel has made only 2 starts with a 4.39 FIP and 1.40 WHIP, making this one of the widest pitching edges on the board.
- Schwarber at home: Kyle Schwarber has been mashing at Citizens Bank Park with a 1.055 OPS and 20 home runs in 170 at-bats. He represents the biggest single threat to McLean, especially in a hitter-friendly ballpark on an 83-degree afternoon.
- Phillies’ home splits: Philadelphia is 26-22 at home with Bryce Harper (.922 OPS), Brandon Marsh (.885 OPS), and Trea Turner (.778 OPS) all producing in front of a supportive crowd. The lineup’s home production exceeds what the overall .702 OPS suggests.
- Mets road struggles: New York is 20-30 on the road and carries just a .682 team OPS. Juan Soto (.861 OPS away) is the clear offensive engine, but beyond him the lineup drops significantly. Mark Vientos (hand, D10 IL) is unavailable.
- Sharp unanimity: 91% Moneyline handle plus 93% Run Line handle on the Mets is remarkable for a last-place team on the road. The market is isolating the McLean-vs-Rangel mismatch as the dominant factor, discounting records entirely.
This game is a study in pitching separation. McLean’s 0.84 HR/9 limits the longball threat that Schwarber and Harper pose, and his 27.9% K rate should keep the Phillies’ contact-heavy approach in check. Rangel’s limited track record (2 starts) and 10.6% walk rate create traffic for a Mets lineup that, while weak overall, features Soto and Lindor capable of big damage in short sequences. The Phillies’ bullpen carries a 4.20 team ERA and 1.31 WHIP, so any early Rangel trouble may not be contained. Philadelphia’s home split leaders and the +109 price provide contrarian interest, but the pitching gap is severe enough to justify the sharp money’s confidence in the road side.
Betting Splits Summary
| Category | Edge |
|---|---|
| Public Betting (Moneyline) | Philadelphia Phillies (59% bets) |
| Money Handle (Moneyline) | New York Mets (91% handle) |
| Run Line Handle | NY Mets −1.5 (93% handle) |
| Total Handle | Over 8.5 (58% handle) |
| Biggest Split | Run Line: 93% of handle on NYM −1.5 vs. 19% of bets |
FAQs
What are MLB betting splits?
MLB betting splits show the percentage of bets and money (handle) placed on each side of a market. They help bettors see where the public and sharper money are positioned before a game.
What is the difference between bets and handle?
Bets refer to the number of individual wagers placed, while handle refers to the total dollar amount wagered. A small number of large bets can move the handle significantly even when most tickets are on the other side.
What is sharp money?
Sharp money refers to wagers placed by professional or experienced bettors. It is often identified by a gap between bet percentage and handle percentage: when a side has more of the money than the tickets, larger (potentially sharper) bets are driving the action.
Should you follow betting splits?
Betting splits are one piece of the puzzle, not a standalone strategy. They are most useful when combined with line movement, matchup stats, and situational context. A large handle-to-bet discrepancy can highlight where professionals are positioned, but public money wins often enough that blindly fading it is not a guaranteed edge.
How often do DraftKings betting splits update?
DraftKings betting splits update approximately every two minutes, giving bettors a near real-time look at how the market is moving throughout the day.
