

Looking for today’s Boston Red Sox vs. Tampa Bay Rays betting splits? Below you’ll find the latest DraftKings Sportsbook betting percentages, including Moneyline, Run Line and total splits, plus where the public is betting, where larger wagers may indicate sharp money, and key matchup stats before first pitch.
Boston Red Sox vs. Tampa Bay Rays Odds
| Market | Boston Red Sox | Tampa Bay Rays |
|---|---|---|
| Moneyline | −123 | +102 |
| Run Line | −1.5 (+166) | +1.5 (−203) |
| Total | O/U 8 (Over −114 / Under −105) | |
DraftKings Betting Splits
| Market | Side | Bets % | Handle % |
|---|---|---|---|
| Moneyline | Boston Red Sox | 84% | 68% |
| Moneyline | Tampa Bay Rays | 16% | 32% |
| Run Line | BOS Red Sox −1.5 | 72% | 40% |
| Run Line | TB Rays +1.5 | 28% | 60% |
| Total | Over 8 | 45% | 46% |
| Total | Under 8 | 55% | 54% |
Public Betting Trends
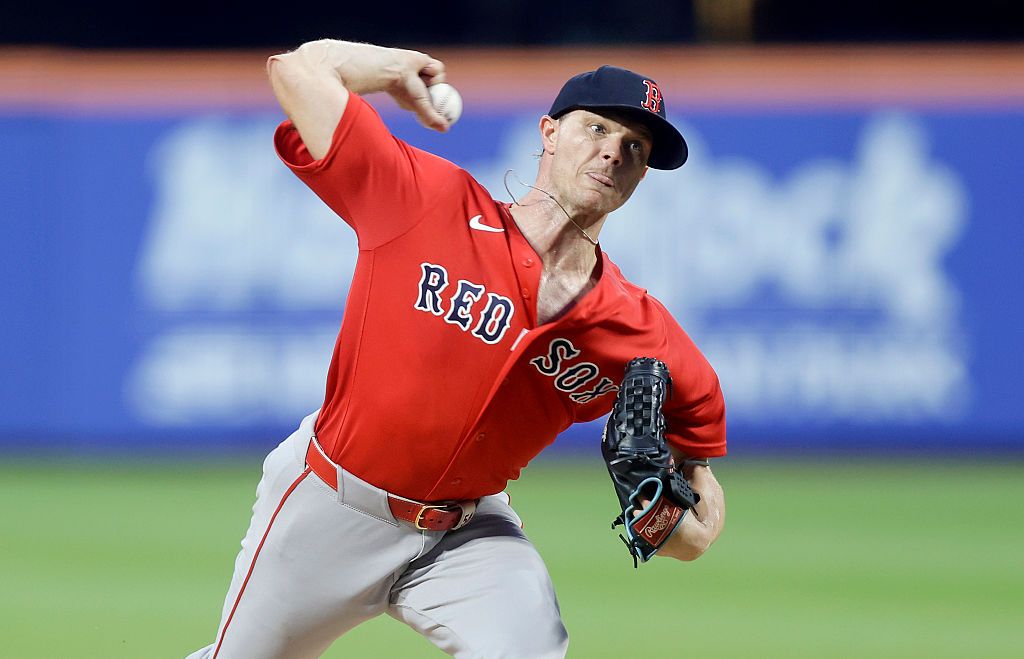
Boston is the overwhelming public choice at 84% of Moneyline bets, driven by a 12-game winning streak and Sonny Gray on the mound. That is about as one-sided as ticket distribution gets. However, the handle tells a more nuanced story: only 68% is on Boston, meaning 32% of the money is backing Tampa Bay despite just 16% of the tickets. That 16-point gap between Tampa Bay’s bet percentage and handle percentage signals some sharper money fading the streak at +102.
The Run Line shows a more pronounced split. Boston −1.5 has 72% of bets but only 40% of the handle, while Tampa Bay +1.5 holds 60% of the money on just 28% of tickets. This is a clear sharp-money indicator: larger wagers are taking the points with the Rays, comfortable that a one-run loss still cashes. The public loves backing a hot team to win big, but the money is hedging toward the road underdog staying within the margin.
The total is nearly split, with 55% of bets and 54% of handle on Under 8. This is one of the most balanced totals on the slate, reflecting two quality starters (Gray 2.54 ERA, McClanahan 2.83 ERA) in a game where both sides of the number have reasonable support. No sharp lean is detectable here.
Boston Red Sox vs. Tampa Bay Rays Stats
Team Batting Stats
| Stat | Boston Red Sox | Tampa Bay Rays |
|---|---|---|
| AVG | .244 | .257 |
| OBP | .315 | .332 |
| SLG | .394 | .399 |
| ISO | .150 | .142 |
| OPS | .709 | .731 |
| K% | 21.9% | 18.9% |
Starting Pitcher Stats
| Stat | Sonny Gray (BOS) | Shane McClanahan (TB) |
|---|---|---|
| Record | 11-1 | 8-5 |
| ERA | 2.54 | 2.83 |
| WHIP | 1.10 | 1.13 |
| FIP | 3.53 | 3.15 |
| xFIP | 3.62 | 3.81 |
| WAR | 1.85 | 2.17 |
| K% | 22.3% | 23.2% |
| BB% | 6.3% | 7.9% |
| HR/9 | 0.94 | 0.63 |
Key Matchup Numbers
- Boston’s streak: The Red Sox are on a 12-game winning streak (10-0 in last 10) despite a modest .709 team OPS. That level of sustained winning from a below-average offense suggests pitching and timely hitting carrying unsustainable weight.
- McClanahan’s underlying edge: Shane McClanahan owns a 3.15 FIP and 2.17 WAR compared to Gray’s 3.53 FIP and 1.85 WAR. His 0.63 HR/9 is elite and particularly relevant at Fenway Park, where the Green Monster can turn fly balls into doubles. McClanahan has been the better pitcher by peripheral metrics despite Gray’s flashier win-loss record.
- Tampa Bay’s contact ability: The Rays’ 18.9% strikeout rate is among the best in baseball. Against Gray’s relatively modest 22.3% K rate, Tampa Bay should put the ball in play consistently, creating opportunities for BABIP-driven rallies.
- Boston’s home struggles: Despite the streak, the Red Sox are just 20-27 at Fenway this season. Their .294 BABIP and .150 ISO at home suggest they have not consistently generated power at their own park.
- Sharp money lean: The 32-point handle gap on the Run Line (60% handle on TB +1.5 vs. 28% bets) is the clearest contrarian indicator in this game. Professionals are betting against the streak, not with it.
This is a classic public-vs-sharps setup. Boston’s 12-game winning streak has inflated their ticket count to 84%, but the underlying numbers paint a more competitive picture. Tampa Bay owns the better team OPS (.731 vs .709), the better road record relative to expectations (21-26 while leading the AL East at 56-41), and a starter whose peripherals (3.15 FIP, 0.63 HR/9) are arguably superior to Gray’s. Boston’s depleted roster (Houck, Crochet, Casas, Anthony, Mayer all on the IL) has leaned heavily on Gray and momentum. Willson Contreras (.985 OPS at home) anchors the lineup, but the supporting cast is thin. The Rays’ 4-game losing streak and Boston’s momentum create a stark narrative gap that the sharps appear willing to exploit at a +102 price.
Betting Splits Summary
| Category | Edge |
|---|---|
| Public Betting (Moneyline) | Boston Red Sox (84% bets) |
| Money Handle (Moneyline) | Boston Red Sox (68% handle) |
| Run Line Handle | TB Rays +1.5 (60% handle) |
| Total Handle | Under 8 (54% handle) |
| Biggest Split | Run Line: 60% of handle on TB +1.5 vs. 28% of bets |
FAQs
What are MLB betting splits?
MLB betting splits show the percentage of bets and money (handle) placed on each side of a market. They help bettors see where the public and sharper money are positioned before a game.
What is the difference between bets and handle?
Bets refer to the number of individual wagers placed, while handle refers to the total dollar amount wagered. A small number of large bets can move the handle significantly even when most tickets are on the other side.
What is sharp money?
Sharp money refers to wagers placed by professional or experienced bettors. It is often identified by a gap between bet percentage and handle percentage: when a side has more of the money than the tickets, larger (potentially sharper) bets are driving the action.
Should you follow betting splits?
Betting splits are one piece of the puzzle, not a standalone strategy. They are most useful when combined with line movement, matchup stats, and situational context. A large handle-to-bet discrepancy can highlight where professionals are positioned, but public money wins often enough that blindly fading it is not a guaranteed edge.
How often do DraftKings betting splits update?
DraftKings betting splits update approximately every two minutes, giving bettors a near real-time look at how the market is moving throughout the day.