

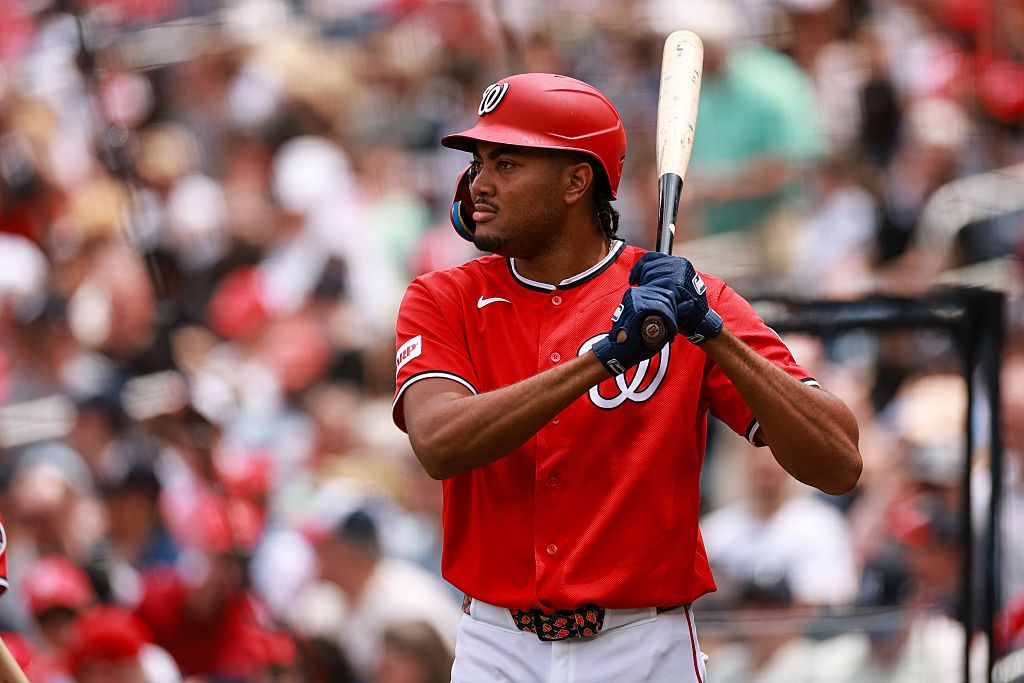
Looking for today’s Athletics vs. Nationals betting splits? Below you’ll find the latest DraftKings Sportsbook betting percentages, Moneyline, Run Line and total splits, plus where the public is betting, where larger wagers may indicate sharp money, and key matchup stats before first pitch.
Athletics vs. Nationals Odds
| Market | Side | Odds |
|---|---|---|
| Moneyline | Athletics | +112 |
| Moneyline | WAS Nationals | −135 |
| Run Line | Athletics +1.5 | −145 |
| Run Line | WAS Nationals -1.5 | +120 |
| Total | Over 10 | −112 |
| Total | Under 10 | −107 |
Washington is a moderate road favorite at −135, making the Athletics home underdogs at +112. The O/U 10 is one of the higher totals on the Friday slate, juiced slightly to the over at −112, reflecting two pitchers who have allowed their share of contact and an 88-degree night game at Sutter Health Park.
DraftKings Betting Splits
| Market | Side | Handle % | Bets % |
|---|---|---|---|
| Moneyline | Athletics | 34% | 23% |
| Moneyline | WAS Nationals | 66% | 77% |
| Run Line | Athletics +1.5 | 2% | 59% |
| Run Line | WAS Nationals -1.5 | 98% | 41% |
| Total | Over 10 | 92% | 61% |
| Total | Under 10 | 8% | 39% |
Public Betting Trends
The Moneyline shows a notable sharp-public split. While 77% of tickets are on Washington, only 66% of handle has followed. That 11-point gap between ticket and money percentage suggests that larger bettors aren’t as convinced about the Nationals at −135 as the general public. Some sharp money is finding value on Oakland at +112, a common pattern when underdogs at plus-money attract informed bettors willing to fade a public-heavy favorite.
The Run Line tells a completely different story. A staggering 98% of handle is on Washington -1.5 at +120, despite only 41% of tickets choosing that side. The public is actually taking Oakland +1.5 (59% of tickets), likely hedging their Nationals Moneyline bets. But the money is emphatic: large bettors expect Washington to win comfortably. The 57-point gap between ticket share and handle concentration is one of the widest on the entire board, indicating massive sharp conviction that if the Nationals win, they win by 2 or more.
The total is similarly one-sided. While 61% of tickets lean over, 92% of the handle is on Over 10, a massive concentration of dollars. The even-ish juice (−112/−107) hasn’t scared anyone away. With both starters carrying WHIP vulnerabilities (Jump 1.29, Cavalli 1.35) and the weather forecast calling for 88 degrees with low humidity, sharp bettors are betting aggressively into the over despite the already-elevated total.
Athletics vs. Nationals Stats
Team Batting Stats
| Stat | Athletics | WAS Nationals |
|---|---|---|
| AVG | .243 | .250 |
| OBP | .321 | .324 |
| SLG | .400 | .435 |
| ISO | .157 | .185 |
| OPS | .721 | .759 |
| K% | 22.9% | 21.4% |
Starting Pitcher Stats
| Stat | Gage Jump (OAK) | Cade Cavalli (WAS) |
|---|---|---|
| Record | 3-4 | 5-4 |
| ERA | 3.51 | 3.83 |
| WHIP | 1.29 | 1.35 |
| FIP | 3.31 | 3.26 |
| xFIP | 3.94 | 3.58 |
| WAR | 1.11 | 2.23 |
| K% | 23.5% | 25.4% |
| BB% | 6.9% | 7.4% |
| HR/9 | 0.74 | 0.73 |
Key Matchup Numbers
- Pitching Comparison: Cavalli has been the more valuable pitcher (2.23 WAR vs. 1.11) with a dominant strikeout rate (25.4% vs. 23.5%) across 20 starts compared to Jump’s 9. Both have excellent HR/9 rates (0.73 and 0.74), but Cavalli’s superior FIP (3.26) and xFIP (3.58) give him the edge in underlying quality.
- Offensive Gap: Washington holds a significant offensive advantage: .759 OPS versus Oakland’s .721, with a particularly wide power gap (ISO .185 vs. .157). The Nationals slug .435 compared to .400, and their better contact rate (21.4% K% vs. 22.9%) means more balls in play against a pitcher in Jump who has only 9 career starts.
- Road Dominance: Washington is a remarkable 28-18 on the road this season, one of baseball’s best road records. CJ Abrams (.974 OPS, 12 HR), Luis Garcia Jr. (.958 OPS, 10 HR), and James Wood (.901 OPS, 10 HR) have been devastating away from home. Oakland is just 19-28 at Sutter Health Park.
- Oakland’s Slide: The Athletics have lost 9 straight and are 1-9 in the last 10, sitting at 41-55 overall. Their top home bats, Nick Kurtz (1.042 OPS, 14 HR) and Tyler Soderstrom (.972 OPS, 8 HR) are dangerous, but Kurtz is on the D10 with a thumb injury, and Brent Rooker is also on the D10 with a knee issue.
- Injury Impact: Oakland is missing two key bats in Kurtz and Rooker plus starter Severino (D60). Washington has been decimated in the rotation (Herz, Irvin, Gray, Parker, Waldichuk, Williams all on the IL), but Cavalli has stepped up as the ace with 8 quality starts in 20 outings.
The 98% Run Line handle reflects sharp confidence in Washington’s superior offense (.759 vs. .721 OPS) and road dominance (28-18) meeting an Oakland team in complete freefall (L9, 1-9 L10) missing its best power bat in Kurtz. Cavalli’s elite strikeout rate and superior WAR make him the better arm despite similar surface ERAs, and the 92% over handle targets both starters’ WHIP vulnerabilities in hot, dry conditions at a small ballpark. The contrarian case for Oakland rests on Jump’s slightly better ERA and home-field advantage, but the A’s dysfunction and depleted lineup make that a difficult sell.
Betting Splits Summary
| Category | Edge |
|---|---|
| Public Betting (ML) | WAS Nationals (77% bets) |
| Money Handle (ML) | WAS Nationals (66%) |
| Run Line Handle | WAS Nationals -1.5 (98%) |
| Total Handle | Over 10 (92%) |
| Biggest Split | Run Line handle: 98% WAS vs. 41% tickets |
FAQs
What are MLB betting splits?
MLB betting splits show the percentage of bets (tickets) and money (handle) on each side of a market. They help identify which side the general public favors and where sharper bettors may be positioned.
What is the difference between bets and handle?
Bets refer to the number of individual wagers placed, while handle is the total dollar amount wagered. A gap between the two can indicate that larger, often sharper, bettors are on one side while the general public favors the other.
What is sharp money?
Sharp money refers to wagers placed by professional or highly informed bettors. It’s often identified when the handle percentage significantly exceeds the bet percentage on a given side, or when line movement contradicts public betting trends.
Should you follow betting splits?
Betting splits are one tool among many. They work best as confirmation alongside your own analysis. Following handle over ticket count tends to be more informative, and splits are most useful when combined with line movement data.
How often do DraftKings betting splits update?
DraftKings betting splits update approximately every two minutes, giving you a near-real-time look at how public money and ticket counts are shifting as the game approaches.