

Looking for today’s Brewers vs. Marlins betting splits? Below you’ll find the latest DraftKings Sportsbook betting percentages, Moneyline, Run Line and total splits, plus where the public is betting, where larger wagers may indicate sharp money, and key matchup stats before first pitch.
Brewers vs. Marlins Odds
| Market | Side | Odds |
|---|---|---|
| Moneyline | MIL Brewers | −155 |
| Moneyline | MIA Marlins | +128 |
| Run Line | MIL Brewers -1.5 | +139 |
| Run Line | MIA Marlins +1.5 | −168 |
| Total | Over 8 | −114 |
| Total | Under 8 | −105 |
Milwaukee is a solid home favorite at −155, implying about 61% win probability. The total is set at O/U 8, with the over carrying slightly more juice at −114, suggesting the market leans toward runs at American Family Field.
DraftKings Betting Splits
| Market | Side | Handle % | Bets % |
|---|---|---|---|
| Moneyline | MIL Brewers | 94% | 82% |
| Moneyline | MIA Marlins | 6% | 18% |
| Run Line | MIL Brewers -1.5 | 71% | 38% |
| Run Line | MIA Marlins +1.5 | 29% | 62% |
| Total | Over 8 | 98% | 59% |
| Total | Under 8 | 2% | 41% |
Public Betting Trends
The Moneyline is a one-way street: 82% of tickets and 94% of handle sit on Milwaukee. The handle outpacing tickets by 12 points indicates that larger bettors are even more aggressive on the Brewers than the general public. At −155, the market has essentially agreed this is Milwaukee’s game to lose, and the betting community is not pushing back.
The Run Line shows a classic sharp-vs-public split. While 62% of tickets are on Miami +1.5 (the public grabbing points with the underdog), 71% of the handle is on Milwaukee -1.5. Bigger bettors are laying the run and a half at +139, confident the Brewers win comfortably despite the public’s instinct to take the insurance with the Marlins.
The total market is the most extreme split on this game. An overwhelming 98% of the handle is on Over 8, dwarfing the 59% ticket share. This is an extraordinary concentration of money on one side, suggesting very large wagers have been placed on the over. Whether this reflects confidence in both offenses producing or skepticism about one or both starters limiting damage, the money is screaming that this game goes over 8 runs.
Brewers vs. Marlins Stats
Team Batting Stats
| Stat | MIL Brewers | MIA Marlins |
|---|---|---|
| AVG | .254 | .253 |
| OBP | .337 | .330 |
| SLG | .398 | .411 |
| ISO | .144 | .158 |
| OPS | .735 | .741 |
| K% | 20.9% | 21.3% |
Starting Pitcher Stats
| Stat | Logan Henderson (MIL) | Sandy Alcantara (MIA) |
|---|---|---|
| Record | 3-1 | 10-5 |
| ERA | 3.18 | 4.00 |
| WHIP | 0.99 | 1.22 |
| FIP | 2.47 | 3.78 |
| xFIP | 3.28 | 4.14 |
| WAR | 1.03 | 2.45 |
| K% | 30.6% | 18.4% |
| BB% | 6.3% | 6.1% |
| HR/9 | 0.64 | 0.90 |
Key Matchup Numbers
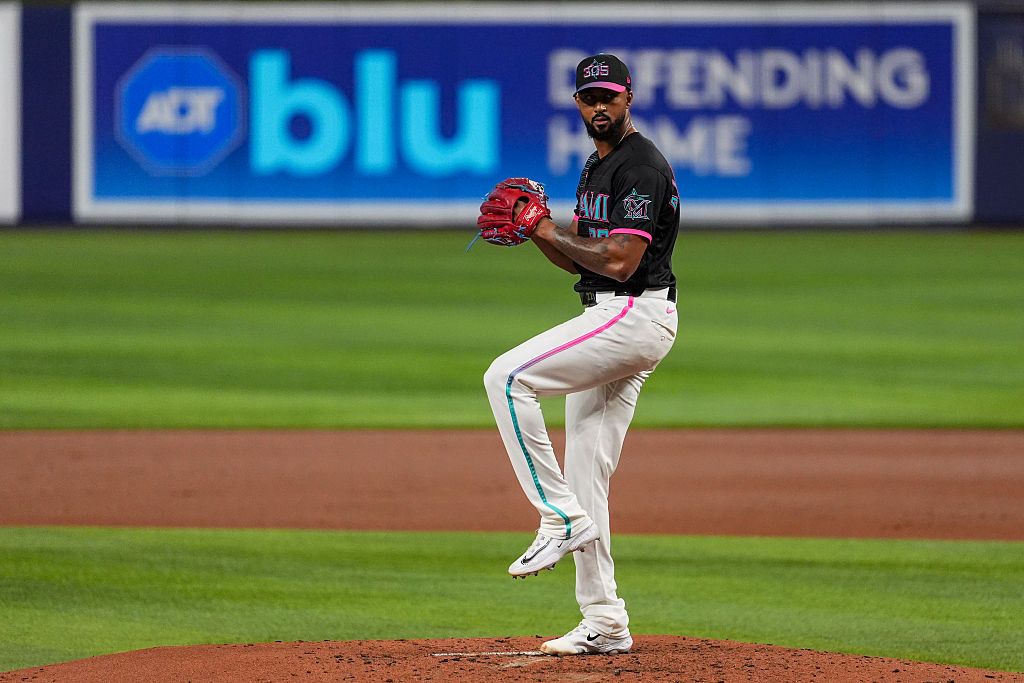
- Pitching Edge: Henderson has been dominant in his 6 starts: a 2.47 FIP, 30.6% K rate, and sub-1.00 WHIP. Alcantara brings durability (20 starts, 14 quality starts), but his 4.00 ERA and 4.14 xFIP indicate a pitcher who has been league-average rather than the ace Miami needs in this spot.
- Offensive Parity: These lineups are remarkably similar. Miami actually holds a slight edge in OPS (.741 vs. .735) and ISO (.158 vs. .144), while Milwaukee counters with a better OBP (.337 vs. .330) driven by a league-leading 10.1% walk rate.
- Home Dominance: Milwaukee is 29-18 at American Family Field and sits atop the NL Central at 59-37. The Brewers’ home split leaders include Jackson Chourio (.908 OPS, 8 HR) and Brice Turang (.898 OPS, 6 HR), giving the middle of the order consistent production in this venue.
- Road Struggles: Miami is 21-25 away from home despite a solid 52-45 overall record. Their road OPS leaders include Esteury Ruiz (.897 OPS) and Otto Lopez (.878 OPS), but the team has been inconsistent away from loanDepot Park.
- Both Teams Slumping: Milwaukee and Miami both enter on 3-game losing streaks. Neither team carries momentum into this matchup, though the Brewers’ overall record and home-field advantage still position them as clear favorites.
Henderson’s elite peripherals (2.47 FIP, 30.6% K%) against a Miami lineup that strikes out at a manageable 21.3% rate create an interesting tension. The 98% over handle despite Henderson’s dominance likely reflects the market fading Alcantara, whose 4.14 xFIP and contact-dependent approach (18.4% K%) could leave him vulnerable to a Milwaukee lineup that excels at getting on base and working counts.
Betting Splits Summary
| Category | Edge |
|---|---|
| Public Betting (ML) | MIL Brewers (82% bets) |
| Money Handle (ML) | MIL Brewers (94%) |
| Run Line Handle | MIL Brewers -1.5 (71%) |
| Total Handle | Over 8 (98%) |
| Biggest Split | Total handle: 98% Over vs. 59% tickets |
FAQs
What are MLB betting splits?
MLB betting splits show the percentage of bets (tickets) and money (handle) on each side of a market. They help identify which side the general public favors and where sharper bettors may be positioned.
What is the difference between bets and handle?
Bets refer to the number of individual wagers placed, while handle is the total dollar amount wagered. A gap between the two can indicate that larger, often sharper, bettors are on one side while the general public favors the other.
What is sharp money?
Sharp money refers to wagers placed by professional or highly informed bettors. It’s often identified when the handle percentage significantly exceeds the bet percentage on a given side, or when line movement contradicts public betting trends.
Should you follow betting splits?
Betting splits are one tool among many. They work best as confirmation alongside your own analysis. Following handle over ticket count tends to be more informative, and splits are most useful when combined with line movement data.
How often do DraftKings betting splits update?
DraftKings betting splits update approximately every two minutes, giving you a near-real-time look at how public money and ticket counts are shifting as the game approaches.