

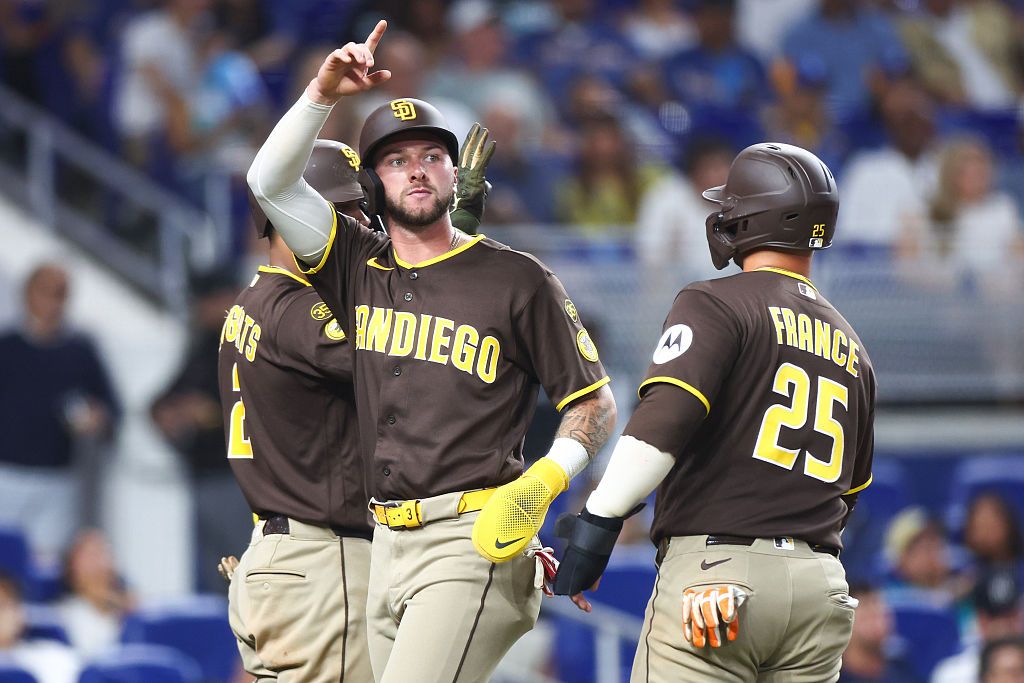
Looking for today’s Miami Marlins vs. San Diego Padres betting splits? Below you’ll find the latest DraftKings Sportsbook Moneyline, Run Line and total betting percentages, plus where the public and sharp money are landing before first pitch.
Marlins vs. Padres Odds
| Market | Marlins (Home) | Padres (Away) |
|---|---|---|
| Moneyline | -131 | +109 |
| Run Line | -1.5 (+154) | +1.5 (-188) |
| Total | Over 8.5 (-120) | Under 8.5 (+100) |
Miami opens as a moderate home favorite at -131 on the Moneyline, with the total set at O/U 8.5. The Run Line prices San Diego at -188 to cover +1.5, reflecting the expectation of a competitive contest between two teams with identical 52-53 records.
DraftKings Betting Splits
| Market | Side | Bets % | Handle % |
|---|---|---|---|
| Moneyline | Marlins | 44% | 80% |
| Moneyline | Padres | 56% | 20% |
| Run Line | Marlins -1.5 | 33% | 98% |
| Run Line | Padres +1.5 | 67% | 2% |
| Total | Over 8.5 | 73% | 59% |
| Total | Under 8.5 | 27% | 41% |
Public Betting Trends
The most striking split in this matchup is on the Moneyline, where 56% of bets are on the Padres but a massive 80% of the handle sits with the Marlins. That 36-point gap between bets and handle points to sharp or high-limit action backing Miami as the home favorite. The Run Line tells an even more extreme story: only 33% of bets are on Marlins -1.5, yet 98% of the money is there. On the total, 73% of bets favor the Over, and the handle leans the same way at 59%, though the Under is attracting a slightly higher proportion of larger wagers relative to its bet count.
Marlins vs. Padres Stats
Team Batting Stats
| Stat | Marlins | Padres |
|---|---|---|
| AVG | .250 | .230 |
| OBP | .326 | .308 |
| SLG | .405 | .382 |
| OPS | .731 | .690 |
| ISO | .155 | .152 |
| BABIP | .300 | .273 |
| K% | 21.7% | 22.4% |
| BB% | 8.6% | 8.9% |
Team Pitching Stats
| Stat | Marlins | Padres |
|---|---|---|
| ERA | 4.08 | 4.21 |
| WHIP | 1.255 | 1.336 |
| K/9 | 8.58 | 8.29 |
| K/BB | 2.43 | 2.30 |
| OBA | .230 | .248 |
Starting Pitcher Stats
| Stat | Janson Junk (MIA) | Walker Buehler (SD) |
|---|---|---|
| Record | 4-6 | 6-5 |
| ERA | 5.09 | 5.23 |
| WHIP | 1.348 | 1.426 |
| FIP | 4.61 | 4.37 |
| xFIP | 4.43 | 4.33 |
| WAR | 0.77 | 1.00 |
| K% | 17.3% | 20.4% |
| BB% | 6.8% | 9.2% |
| HR/9 | 1.44 | 1.14 |
Key Matchup Numbers
- Moneyline handle gap: 80% of the money on Miami despite only 44% of bets, a 36-point sharp-action indicator favoring the home side.
- Run Line concentration: 98% of Run Line handle on Marlins -1.5 with just 33% of tickets, the largest bets-to-handle divergence on the board.
- Batting edge: Miami holds a .250/.326/.731 slash line compared to San Diego’s .230/.308/.690, a 41-point OPS advantage for the home club.
- Pitching staff: The Marlins own a 4.08 team ERA and 1.255 WHIP versus the Padres’ 4.21 ERA and 1.336 WHIP.
- Starter ERA parity: Both starters carry ERAs above 5.00 (Junk 5.09, Buehler 5.23), supporting the O/U 8.5 total.
- Buehler walk rate: Buehler’s 9.2% BB% is the highest among the two starters, creating free baserunners for a Marlins lineup that ranks better in OBP and BABIP.
Sharp money is heavily concentrated on Miami across both the Moneyline and Run Line, suggesting professional bettors see meaningful value on the home favorite. The Marlins’ superior team batting numbers and pitching staff metrics reinforce the market’s lean, while both pitchers’ elevated ERAs align with the 73% public Over lean on a total of O/U 8.5.
Betting Splits Summary
| Metric | Marlins/Over | Padres/Under |
|---|---|---|
| ML Bets % | 44% | 56% |
| ML Handle % | 80% | 20% |
| RL Bets % | 33% | 67% |
| RL Handle % | 98% | 2% |
| Total Bets % | 73% | 27% |
| Total Handle % | 59% | 41% |
FAQs
What are MLB betting splits?
MLB betting splits show how the betting public is wagering on a game by breaking down the percentage of bets and handle (total money wagered) on each side of a market. They are available for the Moneyline, Run Line and total on DraftKings Sportsbook.
What is the difference between bets and handle?
Bets refer to the number of individual wagers placed on a side, while handle represents the total dollar amount wagered. A side can have fewer bets but a larger handle when high-limit bettors place large individual wagers on that outcome.
How do betting splits identify sharp money?
When a small percentage of bets accounts for a disproportionately large share of the handle, it typically signals sharp or professional money. Large bettors tend to place fewer, higher-value wagers, so a wide gap between bets percentage and handle percentage on one side is considered a sharp-money indicator.
Should you follow betting splits?
Betting splits are one useful data point among many. Following sharp-money indicators (handle diverging from bets) has historically shown more value than simply siding with the public. However, splits should be used alongside other research such as pitching matchups, team stats and lineup information.
How often do DraftKings betting splits update?
DraftKings betting splits update periodically throughout the day as new wagers come in. The percentages can shift meaningfully in the hours leading up to first pitch as late sharp action arrives, so checking closer to game time gives the most current picture.
What is the best bet for Marlins vs. Padres?
Based on today’s splits, sharp money is overwhelmingly on the Marlins. Miami is drawing 80% of the Moneyline handle and a remarkable 98% of the Run Line handle despite being on the minority of tickets. The home club also carries superior team batting (.731 OPS vs. .690) and pitching (4.08 ERA vs. 4.21) numbers, making Marlins -131 the side aligned with professional action.