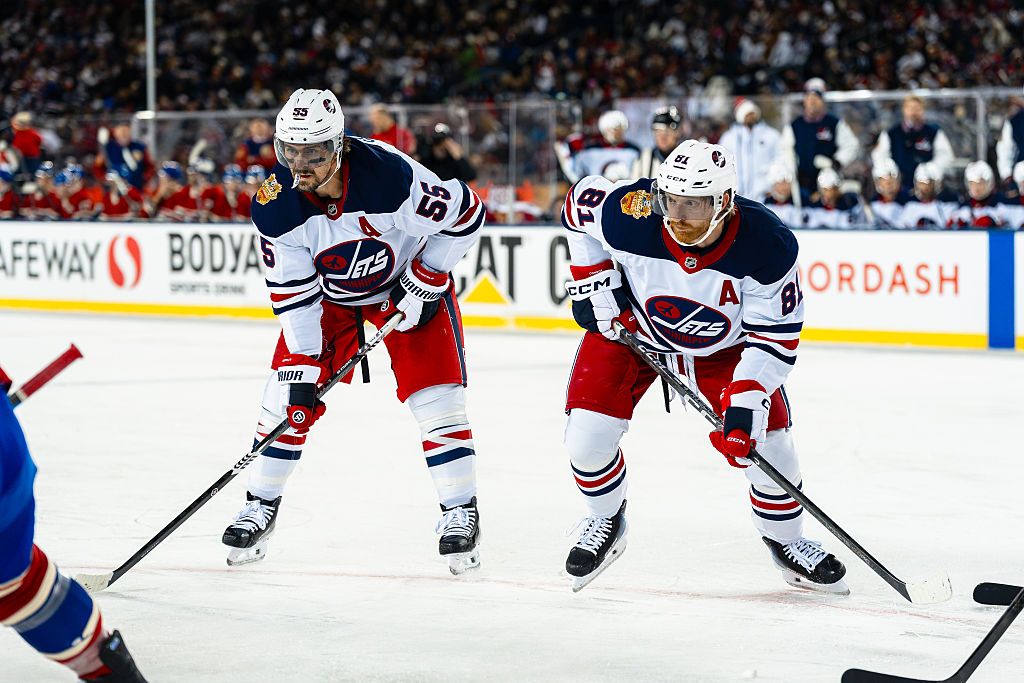
Looking for today’s NHL public betting trends and odds? Below you’ll find the latest DraftKings Sportsbook Moneyline, puck line and total betting percentages for all 11 games on Thursday’s slate, from the Columbus Blue Jackets visiting the Carolina Hurricanes to the Vancouver Canucks visiting the San Jose Sharks, plus where the public and sharp money are landing before puck drop.
Blues Moneyline (-115): St. Louis draws just 14% of Moneyline bets but 69% of the handle, the largest Moneyline reverse split on the slate.
Ryan Leonard Over 1.5 Shots on Goal (-170): Leonard is over in all 10 of his last 10 games, averaging 2.6 shots.
Capitals Moneyline (-112): Washington holds 85% of the Moneyline handle on 60% of bets against a Nashville team ranked 24th in 5v5 xGoals %.
Kyle Connor Over 2.5 Shots on Goal (-170): Connor is over in 9 of his last 10 games, averaging 3.8 shots.
Mammoth Moneyline (-130): Utah owns 98% of the Moneyline money on 70% of bets behind the league’s second-ranked power play and third-ranked 5v5 xGoals %.
Blue Jackets at Hurricanes Odds and Betting Trends
Market
Hurricanes (CAR)
Blue Jackets (CBJ)
Bets %
Handle %
Moneyline
-250
+205
88% / 12%
73% / 27%
Puck line
-1.5 (+102)
+1.5 (-122)
81% / 19%
99% / 1%
Total
Over 6.5 (+114)
Under 6.5 (-135)
7% / 93%
31% / 69%
Team Stats
Stat
CAR
CBJ
Record
10-2-2
5-5-0
Goals For/Game
3.79 (3rd)
2.50 (28th)
Goals Allowed/Game
2.36 (4th)
3.30 (21st)
Shots For/Game
33.6 (1st)
25.6 (T-23rd)
Shots Against/Game
21.9 (1st)
28.1 (T-19th)
Power Play %
23.5% (10th)
11.1% (30th)
Penalty Kill %
83.3% (11th)
72.7% (23rd)
xGoals %
61.6% (1st)
44.5% (28th)
5v5 xGoals %
60.4% (1st)
46.0% (25th)
Goalies
Goalie
Team
GS
Record
SV%
GSAx
Pyotr Kochetkov
CAR
8
8-0-0
.918
+5.5
Brandon Bussi
CAR
6
2-2-2
.865
-4.6
Cam Talbot
CBJ
5
3-2-0
.894
+2.5
Jet Greaves
CBJ
5
2-3-0
.883
-0.4
Carolina leads the league in xGoals %, shots for and shots against, and the Hurricanes -1.5 holds 99% of the puck line handle. The Under 6.5 draws 93% of total bets, though the Over takes a larger 31% share of the money.
Mammoth at Penguins Odds and Betting Trends
Market
Penguins (PIT)
Mammoth (UTA)
Bets %
Handle %
Moneyline
+110
-130
30% / 70%
2% / 98%
Puck line
+1.5 (-205)
-1.5 (+170)
86% / 14%
76% / 24%
Total
Over 6.5 (-135)
Under 6.5 (+114)
67% / 33%
100% / 0%
Team Stats
Stat
PIT
UTA
Record
5-6-1
8-5-0
Goals For/Game
3.25 (12th)
3.62 (7th)
Goals Allowed/Game
3.25 (20th)
3.31 (22nd)
Shots For/Game
27.8 (14th)
30.1 (6th)
Shots Against/Game
27.5 (15th)
24.1 (T-3rd)
Power Play %
20.6% (17th)
34.8% (2nd)
Penalty Kill %
83.9% (8th)
67.4% (29th)
xGoals %
49.0% (19th)
56.6% (5th)
5v5 xGoals %
52.9% (13th)
57.9% (3rd)
Goalies
Goalie
Team
GS
Record
SV%
GSAx
Arturs Silovs
PIT
8
5-3-0
.890
+1.7
Sergei Murashov
PIT
4
0-3-1
.883
-1.4
Karel Vejmelka
UTA
10
6-4-0
.881
-4.8
Sebastian Cossa
UTA
3
2-1-0
.820
-2.7
Utah draws 98% of the Moneyline handle, and 100% of the total money sits on the Over 6.5. Utah’s second-ranked power play meets a Pittsburgh penalty kill ranked 8th, while the Mammoth’s 29th-ranked penalty kill gives the Penguins a path, and Pittsburgh is 1-5-1 on the road but 4-1-0 at home.
Jets at Lightning Odds and Betting Trends
Market
Lightning (TBL)
Jets (WPG)
Bets %
Handle %
Moneyline
-238
+195
82% / 18%
83% / 17%
Puck line
-1.5 (+110)
+1.5 (-130)
58% / 42%
93% / 7%
Total
Over 6.5 (+120)
Under 6.5 (-142)
33% / 67%
97% / 3%
Team Stats
Stat
TBL
WPG
Record
7-3-1
4-5-3
Goals For/Game
3.45 (10th)
2.33 (T-29th)
Goals Allowed/Game
3.09 (T-16th)
3.00 (T-11th)
Shots For/Game
30.4 (T-4th)
27.0 (T-18th)
Shots Against/Game
24.6 (5th)
28.8 (24th)
Power Play %
15.0% (27th)
18.2% (22nd)
Penalty Kill %
76.7% (21st)
74.2% (22nd)
xGoals %
56.3% (6th)
47.5% (21st)
5v5 xGoals %
56.4% (5th)
47.4% (21st)
Goalies
Goalie
Team
GS
Record
SV%
GSAx
Andrei Vasilevskiy
TBL
8
5-3-0
.884
-1.1
Dennis Hildeby
TBL
3
2-0-1
.885
-0.1
Stuart Skinner
WPG
8
3-2-3
.911
+5.9
Clay Stevenson
WPG
4
1-3-0
.870
-2.4
Tampa Bay is 5-0-0 at home, and the Lightning -1.5 holds 93% of the puck line handle on just 58% of bets. The Over 6.5 draws only 33% of bets but 97% of the money, even with Winnipeg scoring 2.33 goals per game.
Blackhawks at Red Wings Odds and Betting Trends
Market
Red Wings (DET)
Blackhawks (CHI)
Bets %
Handle %
Moneyline
-180
+150
78% / 22%
90% / 10%
Puck line
-1.5 (+142)
+1.5 (-170)
36% / 64%
47% / 53%
Total
Over 5.5 (-135)
Under 5.5 (+114)
63% / 38%
99% / 1%
Team Stats
Stat
DET
CHI
Record
5-4-3
4-8-0
Goals For/Game
2.58 (26th)
2.17 (31st)
Goals Allowed/Game
2.92 (T-8th)
3.67 (30th)
Shots For/Game
29.8 (7th)
21.8 (31st)
Shots Against/Game
25.7 (9th)
30.2 (27th)
Power Play %
21.4% (15th)
10.3% (31st)
Penalty Kill %
65.9% (30th)
78.4% (17th)
xGoals %
52.2% (11th)
44.4% (29th)
5v5 xGoals %
54.1% (7th)
41.0% (30th)
Goalies
Goalie
Team
GS
Record
SV%
GSAx
John Gibson
DET
8
3-4-1
.867
-4.2
Daniil Tarasov
DET
3
1-0-2
.940
+5.1
Spencer Knight
CHI
10
4-6-0
.897
+1.0
Arvid Soderblom
CHI
2
0-2-0
.820
-2.8
Detroit holds 90% of the Moneyline handle, and Chicago is 0-4-0 on the road with the league’s 30th-ranked 5v5 xGoals %. The Over 5.5 owns 99% of the total money despite two offenses ranked 26th and 31st in scoring.
Canadiens at Stars Odds and Betting Trends
Market
Stars (DAL)
Canadiens (MTL)
Bets %
Handle %
Moneyline
-162
+136
76% / 24%
95% / 5%
Puck line
-1.5 (+160)
+1.5 (-192)
25% / 75%
60% / 40%
Total
Over 5.5 (-142)
Under 5.5 (+120)
25% / 75%
6% / 94%
Team Stats
Stat
DAL
MTL
Record
7-4-1
7-3-2
Goals For/Game
2.67 (25th)
3.00 (T-17th)
Goals Allowed/Game
2.00 (1st)
3.00 (T-11th)
Shots For/Game
26.9 (20th)
28.1 (T-11th)
Shots Against/Game
22.2 (2nd)
28.2 (22nd)
Power Play %
18.5% (21st)
11.4% (29th)
Penalty Kill %
92.9% (1st)
83.7% (10th)
xGoals %
53.4% (8th)
49.1% (18th)
5v5 xGoals %
53.2% (11th)
52.7% (14th)
Goalies
Goalie
Team
GS
Record
SV%
GSAx
Jake Oettinger
DAL
9
6-2-1
.929
+9.4
Casey DeSmith
DAL
3
1-2-0
.887
-1.4
Jacob Fowler
MTL
7
6-1-0
.942
+10.1
Jakub Dobes
MTL
5
1-2-2
.847
-6.3
Dallas allows a league-low 2.00 goals per game and owns 95% of the Moneyline handle. The Under 5.5 takes 94% of the total money, with Oettinger at +9.4 and Fowler at +10.1 in goals saved above expected.
Islanders at Wild Odds and Betting Trends
Market
Wild (MIN)
Islanders (NYI)
Bets %
Handle %
Moneyline
-192
+160
89% / 11%
36% / 64%
Puck line
-1.5 (+136)
+1.5 (-162)
0% / 100%
0% / 100%
Total
Over 5.5 (-120)
Under 5.5 (+100)
69% / 31%
19% / 81%
Team Stats
Stat
MIN
NYI
Record
9-3-2
6-4-2
Goals For/Game
3.14 (T-13th)
2.92 (T-19th)
Goals Allowed/Game
2.21 (3rd)
2.58 (5th)
Shots For/Game
31.3 (3rd)
26.1 (T-21st)
Shots Against/Game
25.1 (T-7th)
26.3 (T-12th)
Power Play %
26.5% (6th)
15.8% (25th)
Penalty Kill %
82.2% (12th)
85.4% (6th)
xGoals %
59.5% (2nd)
46.4% (T-24th)
5v5 xGoals %
57.2% (4th)
49.0% (19th)
Goalies
Goalie
Team
GS
Record
SV%
GSAx
Jesper Wallstedt
MIN
12
8-2-2
.922
+9.9
Calvin Pickard
MIN
2
1-1-0
.833
-2.3
Ilya Sorokin
NYI
8
5-3-0
.919
+5.7
Semyon Varlamov
NYI
4
1-1-2
.891
+5.4
Minnesota draws 89% of Moneyline bets, but New York holds 64% of the handle, a sharp lean toward the underdog. The Under 5.5 takes 81% of the total money on 31% of bets, matching two defenses ranked 3rd and 5th in goals allowed.
Capitals at Predators Odds and Betting Trends
Market
Predators (NSH)
Capitals (WSH)
Bets %
Handle %
Moneyline
-108
-112
40% / 60%
15% / 85%
Puck line
-1.5 (+225)
+1.5 (-278)
12% / 88%
6% / 94%
Total
Over 6.5 (-105)
Under 6.5 (-115)
40% / 60%
14% / 86%
Team Stats
Stat
NSH
WSH
Record
4-3-5
7-4-0
Goals For/Game
2.83 (22nd)
3.55 (9th)
Goals Allowed/Game
3.00 (T-11th)
3.09 (T-16th)
Shots For/Game
25.6 (T-23rd)
27.7 (T-15th)
Shots Against/Game
29.1 (25th)
28.1 (T-19th)
Power Play %
31.7% (3rd)
19.4% (20th)
Penalty Kill %
87.5% (4th)
80.6% (15th)
xGoals %
48.3% (20th)
50.5% (14th)
5v5 xGoals %
46.2% (24th)
53.4% (9th)
Goalies
Goalie
Team
GS
Record
SV%
GSAx
Juuse Saros
NSH
9
3-2-4
.906
+3.9
Justus Annunen
NSH
2
1-1-0
.846
-1.0
Logan Thompson
WSH
8
5-3-0
.903
+4.6
Charlie Lindgren
WSH
3
2-1-0
.886
-0.4
Washington holds 85% of the Moneyline handle and outranks Nashville in 5v5 xGoals %, 9th to 24th. Nashville’s third-ranked power play is the counter, and the Under 6.5 owns 86% of the total money.
Bruins at Blues Odds and Betting Trends
Market
Blues (STL)
Bruins (BOS)
Bets %
Handle %
Moneyline
-115
-105
14% / 86%
69% / 31%
Puck line
-1.5 (+220)
+1.5 (-270)
2% / 98%
7% / 93%
Total
Over 5.5 (-130)
Under 5.5 (+110)
83% / 17%
97% / 3%
Team Stats
Stat
STL
BOS
Record
5-6-1
9-3-1
Goals For/Game
2.92 (T-19th)
3.77 (4th)
Goals Allowed/Game
3.08 (15th)
2.15 (2nd)
Shots For/Game
28.1 (T-11th)
25.5 (T-25th)
Shots Against/Game
27.8 (17th)
28.1 (T-19th)
Power Play %
21.9% (14th)
22.0% (13th)
Penalty Kill %
84.4% (7th)
80.4% (16th)
xGoals %
49.8% (T-16th)
50.3% (15th)
5v5 xGoals %
49.7% (18th)
53.5% (8th)
Goalies
Goalie
Team
GS
Record
SV%
GSAx
Joel Hofer
STL
8
4-3-1
.917
+3.2
Jordan Binnington
STL
4
1-3-0
.846
-4.5
Jeremy Swayman
BOS
10
7-2-1
.921
+8.2
Michael DiPietro
BOS
3
2-1-0
.941
+4.6
Boston draws 86% of Moneyline bets, but St. Louis holds 69% of the handle, the slate’s biggest Moneyline reverse split. Boston ranks 25th in shots per game but fourth in scoring, and the Over 5.5 takes 97% of the total money.
Sabres at Ducks Odds and Betting Trends
Market
Ducks (ANA)
Sabres (BUF)
Bets %
Handle %
Moneyline
+120
-142
24% / 76%
9% / 91%
Puck line
+1.5 (-205)
-1.5 (+170)
94% / 6%
95% / 5%
Total
Over 6.5 (-125)
Under 6.5 (+105)
62% / 38%
86% / 14%
Team Stats
Stat
ANA
BUF
Record
5-6-1
5-4-3
Goals For/Game
3.08 (15th)
2.75 (24th)
Goals Allowed/Game
3.58 (29th)
3.33 (T-23rd)
Shots For/Game
23.5 (T-29th)
27.6 (17th)
Shots Against/Game
27.7 (16th)
26.2 (T-10th)
Power Play %
23.7% (9th)
9.8% (32nd)
Penalty Kill %
77.6% (19th)
71.4% (T-25th)
xGoals %
45.0% (26th)
49.8% (T-16th)
5v5 xGoals %
44.1% (T-27th)
51.4% (15th)
Goalies
Goalie
Team
GS
Record
SV%
GSAx
Lukas Dostal
ANA
9
4-4-1
.872
+0.2
Ville Husso
ANA
3
1-2-0
.886
+0.9
Ukko-Pekka Luukkonen
BUF
8
3-3-3
.866
-3.6
Colten Ellis
BUF
4
2-1-0
.902
+3.2
Buffalo owns 91% of the Moneyline handle, while the Ducks +1.5 takes 95% of the puck line money. Anaheim is 1-3-1 at home and allows 3.58 goals per game, and the Over 6.5 holds 86% of the total handle.
Senators at Kings Odds and Betting Trends
Market
Kings (LAK)
Senators (OTT)
Bets %
Handle %
Moneyline
-105
-115
22% / 78%
23% / 77%
Puck line
+1.5 (-278)
-1.5 (+225)
79% / 21%
8% / 92%
Total
Over 5.5 (-125)
Under 5.5 (+105)
83% / 17%
93% / 7%
Team Stats
Stat
LAK
OTT
Record
3-6-2
8-5-0
Goals For/Game
2.55 (27th)
2.85 (21st)
Goals Allowed/Game
3.36 (26th)
2.92 (T-8th)
Shots For/Game
27.0 (T-18th)
25.5 (T-25th)
Shots Against/Game
28.6 (23rd)
26.2 (T-10th)
Power Play %
15.2% (26th)
12.7% (28th)
Penalty Kill %
63.6% (32nd)
77.8% (18th)
xGoals %
46.5% (23rd)
51.8% (12th)
5v5 xGoals %
46.9% (23rd)
50.4% (17th)
Goalies
Goalie
Team
GS
Record
SV%
GSAx
Darcy Kuemper
LAK
7
3-3-1
.889
-1.4
Anton Forsberg
LAK
4
0-3-1
.902
+0.1
Linus Ullmark
OTT
8
7-1-0
.945
+8.3
Samuel Ersson
OTT
3
0-3-0
.835
-5.8
Los Angeles is 0-3-0 at home, and Ottawa draws 78% of Moneyline bets and 77% of the handle. The Senators -1.5 gets only 21% of puck line bets but 92% of the money, with Ullmark at +8.3 goals saved above expected.
Canucks at Sharks Odds and Betting Trends
Market
Sharks (SJS)
Canucks (VAN)
Bets %
Handle %
Moneyline
-185
+154
83% / 17%
46% / 54%
Puck line
-1.5 (+130)
+1.5 (-155)
62% / 38%
98% / 2%
Total
Over 6.5 (-130)
Under 6.5 (+110)
75% / 25%
96% / 4%
Team Stats
Stat
SJS
VAN
Record
6-6-1
3-10-1
Goals For/Game
2.77 (23rd)
3.07 (16th)
Goals Allowed/Game
3.38 (27th)
4.64 (32nd)
Shots For/Game
27.7 (T-15th)
20.8 (32nd)
Shots Against/Game
31.1 (31st)
32.8 (32nd)
Power Play %
25.0% (8th)
20.5% (18th)
Penalty Kill %
81.8% (14th)
63.8% (31st)
xGoals %
43.0% (30th)
37.9% (32nd)
5v5 xGoals %
42.0% (29th)
38.4% (32nd)
Goalies
Goalie
Team
GS
Record
SV%
GSAx
Yaroslav Askarov
SJS
8
3-5-0
.898
+5.2
Alex Nedeljkovic
SJS
5
3-1-1
.903
+4.5
Kevin Lankinen
VAN
7
1-7-0
.812
-12.1
Leevi Meriläinen
VAN
7
2-3-1
.900
+1.2
San Jose draws 83% of Moneyline bets, yet Vancouver holds 54% of the handle. The Sharks -1.5 owns 98% of the puck line money against a Vancouver team that ranks last in goals allowed and xGoals %, and the Over 6.5 takes 96% of the total handle.
Notable Player Props
Ryan Leonard (WSH) Shots on Goal O/U 1.5 (-170 / +125): over in 10 of his last 10 games
Jackson LaCombe (ANA) Shots on Goal O/U 1.5 (-110 / -125): under in 10 of his last 10 games
Leo Carlsson (ANA) Shots on Goal O/U 2.5 (+115 / -155): under in 10 of his last 10 games
Adam Fantilli (CBJ) Shots on Goal O/U 1.5 (-190 / +140): over in 9 of his last 10 games
Gabriel Vilardi (WPG) Shots on Goal O/U 1.5 (-135 / +100): over in 9 of his last 10 games
Kyle Connor (WPG) Shots on Goal O/U 2.5 (-170 / +125): over in 9 of his last 10 games
Kirill Kaprizov (MIN) Anytime Goalscorer (-110): scored in 8 of his last 10 games
Mikhail Sergachev (UTA) Shots on Goal O/U 1.5 (-175 / +130): over in 8 of his last 10 games
Steven Stamkos (NSH) Points O/U 0.5 (-185 / +140): over in 8 of his last 10 games
Artemi Panarin (LAK) Shots on Goal O/U 2.5 (-140 / +100): over in 8 of his last 10 games
DK Network AI is your always-on content co-pilot, built to help bring stories to life faster and smarter. Every AI-assisted article receives human editorial oversight and final approval from a DraftKings Network editor before publication.