

Looking for today’s Boston Red Sox vs. Athletics betting splits? Below you’ll find the latest DraftKings Sportsbook Moneyline, Run Line and total betting percentages, plus where the public and sharp money are landing before first pitch.
Red Sox vs. Athletics Odds
| Market | Red Sox (Home) | Athletics (Away) |
|---|---|---|
| Moneyline | −261 | +240 |
| Run Line | -1.5 (−131) | +1.5 (+108) |
| Total | Over 8.5 (−106) | Under 8.5 (−114) |
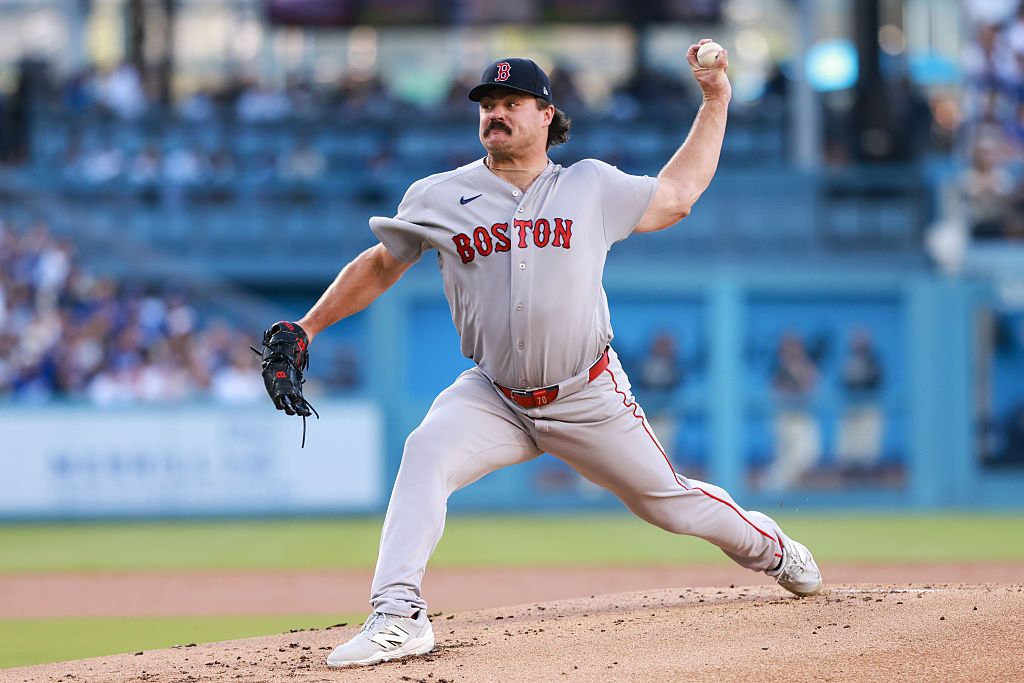
Boston is a heavy home favorite at −261, making the Athletics significant underdogs at +240. The total is set at O/U 8.5, juiced slightly to the Under at −114, reflecting Payton Tolle’s strong 3.30 ERA on the mound against a struggling Athletics offense.
DraftKings Betting Splits
| Market | Side | Bets % | Handle % |
|---|---|---|---|
| Moneyline | Red Sox | 94% | 76% |
| Moneyline | Athletics | 6% | 24% |
| Run Line | Red Sox -1.5 | 93% | 65% |
| Run Line | Athletics +1.5 | 7% | 35% |
| Total | Over 8.5 | 42% | 55% |
| Total | Under 8.5 | 58% | 45% |
Public Betting Trends
The Moneyline and Run Line show some notable handle divergence from the public consensus. While 94% of tickets are on Boston, only 76% of handle has followed, suggesting a pocket of sharp money backing the Athletics at +240. The Run Line tells a similar story: 93% of bets favor Red Sox -1.5, but only 65% of handle agrees, leaving 35% with the Athletics +1.5 on just 7% of tickets. The total is the most balanced market, with 58% of tickets on the Under but 55% of handle on the Over, indicating larger bettors see scoring potential despite the public leaning Under.
Red Sox vs. Athletics Stats
Starting Pitcher Stats
| Stat | Payton Tolle (BOS) | Jack Perkins (ATH) |
|---|---|---|
| Record | 6-6 | 2-7 |
| ERA | 3.30 | 6.72 |
| WHIP | 1.149 | 1.398 |
| FIP | 3.41 | 4.61 |
| xFIP | 3.78 | 4.11 |
| WAR | 2.34 | 0.39 |
| K% | 26.5% | 26.8% |
| BB% | 6.7% | 8.4% |
| HR/9 | 1.07 | 1.71 |
Team Pitching Stats
| Stat | Red Sox | Athletics |
|---|---|---|
| ERA | 3.50 | 5.41 |
| WHIP | 1.227 | 1.494 |
| K/9 | 8.67 | 8.69 |
| K/BB | 3.00 | 2.14 |
| OBA | .240 | .268 |
Team Batting Stats
| Stat | Red Sox | Athletics |
|---|---|---|
| AVG | .247 | .244 |
| OBP | .319 | .319 |
| SLG | .402 | .399 |
| ISO | .155 | .155 |
| OPS | .721 | .718 |
| K% | 21.8% | 22.7% |
Key Matchup Numbers
- Pitching mismatch: Payton Tolle owns a 2.34 WAR across 18 starts with a 3.30 ERA and 1.149 WHIP, while Jack Perkins has managed just 0.39 WAR through 9 starts with a bloated 6.72 ERA and 1.71 HR/9. Tolle’s outs prop is set at O/U 17.5 (Over −173), reflecting the expectation he pitches deep into this game.
- Perkins’ home run vulnerability: Perkins allows 1.71 HR/9, nearly 60% higher than Tolle’s 1.07 mark. His hits allowed prop is set at O/U 5.5, and his strikeouts are at O/U 4.5 (−131 over). Wilyer Abreu (2+ total bases at −112) and Connor Wong (HR at +528) present the most dangerous matchups against a pitcher who has zero quality starts this season.
- Boston’s home split leaders: Wilyer Abreu leads Boston at home with a .252 AVG, .782 OPS, and 10 home runs in 214 at-bats. Anthony Seigler adds a .295 AVG and .861 OPS in 61 at-bats. Masataka Yoshida’s hits prop is O/U 0.5 (−265 over), making him one of the heaviest favorites on the board to record a hit.
- Athletics road split leaders: Carlos Cortes paces the Athletics on the road with a .287 AVG and .829 OPS, including 5 home runs in 115 at-bats. Tommy White (.324 AVG) and Tyler Soderstrom (.236 AVG, .701 OPS, 6 HR) provide secondary threats, though the club is just 24-34 away from home.
- Momentum gap: Boston rides an eight-game winning streak with a 9-1 record over its last 10 games, sitting at 63-51 (3rd AL). The Athletics have lost eight straight and are 1-9 over the last 10, falling to 45-70 (4th AL West, 13.5 games back). This is a collision of the hottest and coldest teams in the American League.
- Injury impact: Boston is without Tanner Houck, Garrett Crochet, and Kutter Crawford from its rotation, plus Roman Anthony and Triston Casas from the lineup, but Adley Rutschman (D10, wrist) could be nearing a return. The Athletics are missing Brent Rooker (D60, knee), Shea Langeliers (D10, knee), Zack Gelof (D10, knee), and Nick Kurtz (D10, thumb), gutting their middle-of-the-order power.
DraftKings Player Props
- Payton Tolle Outs O/U 17.5 (-173 / +130)
- Payton Tolle Earned Runs Allowed O/U 1.5 (-159 / +119)
- Jack Perkins Strikeouts Thrown O/U 4.5 (-131 / +102)
- Jack Perkins Hits Allowed O/U 5.5 (+100 / -133)
- Jarren Duran Hits O/U 0.5 (-229 / +169)
- Masataka Yoshida Hits O/U 0.5 (-265 / +195)
- Wilyer Abreu Total Bases 2+ (-112)
- Connor Wong Hits O/U 0.5 (-182 / +136)
- Lawrence Butler Hits O/U 0.5 (-139 / +105)
DraftKings Featured Parlays
Favorites Flex (+1607)
Six favorites win outright on Friday:
- PHI Phillies to Win (vs TOR)
- PIT Pirates to Win (vs NYM)
- NY Yankees to Win (vs ATL)
- BOS Red Sox to Win (vs ATH)
- MIA Marlins to Win (vs LAA)
- CLE Guardians to Win (@ CWS)
Snooze Fest (+1227)
Four games stay Under the total on Friday:
- ATL @ NYY: Under 8 Runs
- ATH @ BOS: Under 8.5 Runs
- CLE @ CWS: Under 7.5 Runs
- TB @ SEA: Under 7 Runs
Frozen Frames (+1010)
Four games stay scoreless through the first inning:
- LAA @ MIA: No Runs 1st Inning
- ATH @ BOS: No Runs 1st Inning
- CLE @ CWS: No Runs 1st Inning
- MIN @ MIL: No Runs 1st Inning
Base Collectors (+1757)
Four stars each record 2+ total bases:
- Matt Olson 2+ Total Bases
- CJ Abrams 2+ Total Bases
- Otto Lopez 2+ Total Bases
- Ceddanne Rafaela 2+ Total Bases
Betting Splits Summary
| Metric | Red Sox / Over | Athletics / Under |
|---|---|---|
| ML Handle | 76% | 24% |
| ML Bets | 94% | 6% |
| RL Handle | 65% | 35% |
| RL Bets | 93% | 7% |
| Total Handle | 55% | 45% |
| Total Bets | 42% | 58% |
FAQs
What are MLB betting splits?
Betting splits show how the public is wagering on a game by breaking down the percentage of total bets (tickets) and total money (handle) on each side of a market. They help identify which side recreational bettors favor versus where larger, potentially sharper money is landing.
What is the difference between bets and handle?
Bets refer to the number of individual tickets placed, while handle represents the total dollar amount wagered. A side with low bet percentage but high handle percentage suggests fewer bettors placing larger wagers, often interpreted as sharp or professional action.
How do betting splits identify sharp money?
Sharp money refers to wagers placed by professional or highly informed bettors. It is typically identified through handle-vs-bet discrepancies: when a side draws a disproportionate share of money relative to its ticket count, sharps are likely involved.
Should you follow betting splits?
Splits are one tool among many. They are most useful when a clear divergence exists between public tickets and money handle, suggesting professional disagreement with the recreational consensus. They work best combined with line movement analysis and matchup context.
How often do DraftKings betting splits update?
DraftKings betting splits update approximately every two minutes, providing near real-time insight into how the market is moving as game time approaches.
What is the best bet for Red Sox vs. Athletics?
Sharp money shows modest interest in the Athletics at +240 on the Moneyline, with 24% of handle on just 6% of tickets. However, the stronger signal sits on the Run Line, where 35% of handle backs Athletics +1.5 despite only 7% of bets, a 28-point gap suggesting professionals see value in the points. Boston’s eight-game winning streak, Tolle’s 2.34 WAR, and the Athletics’ eight-game losing streak make the Red Sox -1.5 at −131 the most popular play, but the handle divergence points to sharps betting the Athletics will at least keep this game within a run.