

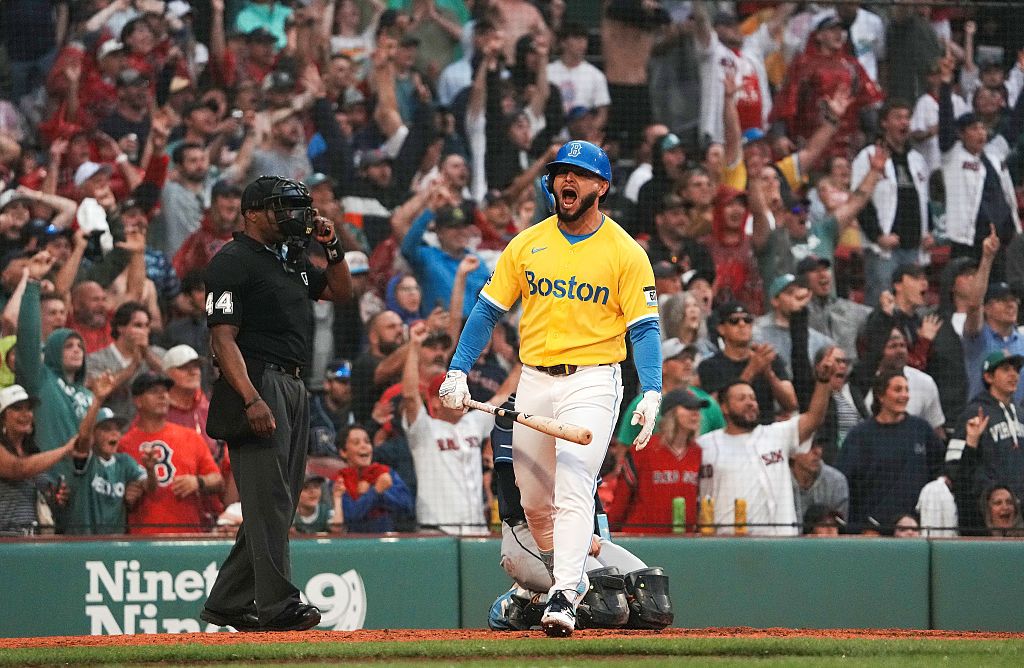
Looking for today’s Boston Red Sox vs. Baltimore Orioles betting splits? Below you’ll find the latest DraftKings Sportsbook Moneyline, Run Line and total betting percentages, plus where the public and sharp money are landing before first pitch.
Red Sox vs. Orioles Game 2 Odds
| Market | Red Sox (Home) | Orioles (Away) |
|---|---|---|
| Moneyline | -149 | +123 |
| Run Line | -1.5 (+141) | +1.5 (-171) |
| Total | Over 9 (-108) | Under 9 (-112) |
Boston is a moderate home favorite at -149 on the Moneyline despite a TBD starter, reflecting the weight of its 14-game winning streak. The total is set at O/U 9, and the Run Line prices the Red Sox at +141 to win by two or more runs.
DraftKings Betting Splits
| Market | Side | Bets % | Handle % |
|---|---|---|---|
| Moneyline | Red Sox | 91% | 35% |
| Moneyline | Orioles | 9% | 65% |
| Run Line | Red Sox | 65% | 3% |
| Run Line | Orioles | 35% | 97% |
| Total | Over 9 | 42% | 79% |
| Total | Under 9 | 58% | 21% |
Public Betting Trends
The public favors Red Sox with 91% of Moneyline bets, but the Orioles command 65% of the handle on just 9% of tickets, a 56-point sharp lean. The Run Line divergence is even starker: 97% of handle backs Orioles +1.5 on just 35% of bets, a 62-point split. The Over 9 commands 79% of handle on 42% of tickets, with sharp money clearly positioned for a higher-scoring game.
Red Sox vs. Orioles Game 2 Stats
Team Batting Stats
| Team | AVG | OBP | SLG | ISO | OPS | K% |
|---|---|---|---|---|---|---|
| Red Sox | .245 | .315 | .394 | .149 | .709 | 21.9% |
| Orioles | .238 | .321 | .398 | .160 | .719 | 24.4% |
Team Pitching Stats
| Team | ERA | WHIP | K/9 | K/BB | OBA |
|---|---|---|---|---|---|
| Red Sox | 3.55 | 1.22 | 8.66 | 2.95 | .237 |
| Orioles | 4.21 | 1.35 | 8.03 | 2.32 | .252 |
Starting Pitcher Stats
Boston has not yet announced a starting pitcher for Game 2. Kyle Bradish takes the mound for Baltimore.
| Pitcher | Record | ERA | WHIP | FIP | xFIP | WAR | K% | BB% | HR/9 |
|---|---|---|---|---|---|---|---|---|---|
| Kyle Bradish (BAL) | 6-9 | 3.61 | 1.35 | 4.01 | 3.99 | 1.53 | 23.3% | 10.8% | 1.01 |
Key Matchup Numbers
- Extreme sharp divergence: The Run Line handle gap is extraordinary: 97% of money on BAL +1.5 versus just 35% of tickets, a 62-point divergence that signals overwhelming professional confidence in Baltimore covering.
- Pitching uncertainty: Boston’s TBD starter in Game 2 creates significant uncertainty. The Red Sox’s bullpen has already been stretched this season with Tanner Houck, Garrett Crochet, Johan Oviedo, and Kutter Crawford all on the D60 IL.
- Bradish profile: Kyle Bradish carries a 3.606 ERA across 19 starts for Baltimore, with a 23.3% K rate. His 1.351 WHIP and 10.8% walk rate introduce baserunner traffic, but he has delivered 9 quality starts this season.
- Offensive edge: Baltimore’s offense edges Boston in OBP (.321 vs. .315), SLG (.398 vs. .394), and ISO (.160 vs. .149), suggesting slightly more raw power despite a lower batting average.
- Home/road splits: Boston’s 22-27 home record is the weakest aspect of its profile, while Baltimore is 21-27 on the road. The Red Sox’s winning streak has been driven heavily by their away performance (29-21).
The splits paint a stark picture of sharp money disagreeing with the public in Game 2. Professional bettors are fading the TBD Boston starter across both the Moneyline and Run Line while expecting a high-scoring game. With Boston’s depleted pitching depth and an unknown arm taking the mound in the nightcap, sharps appear to be capitalizing on the public’s tendency to ride the streak.
Betting Splits Summary
| Metric | Red Sox / Over | Orioles / Under |
|---|---|---|
| Moneyline handle | 35% | 65% |
| Moneyline bets | 91% | 9% |
| Run Line handle | 3% | 97% |
| Run Line bets | 65% | 35% |
| Total handle | 79% | 21% |
| Total bets | 42% | 58% |
FAQs
What are MLB betting splits?
Betting splits show how the public is wagering on a game by breaking down the percentage of total bets (tickets) and total money (handle) on each side of a market. They help identify which side recreational bettors favor versus where larger, potentially sharper money is landing.
What is the difference between bets and handle?
Bets refer to the number of individual tickets placed, while handle represents the total dollar amount wagered. A side with low bet percentage but high handle percentage suggests fewer bettors placing larger wagers, often interpreted as sharp or professional action.
How do betting splits identify sharp money?
Sharp money refers to wagers placed by professional or highly informed bettors. It is typically identified through handle-vs-bet discrepancies: when a side draws a disproportionate share of money relative to its ticket count, sharps are likely involved.
Should you follow betting splits?
Splits are one tool among many. They are most useful when a clear divergence exists between public tickets and money handle, suggesting professional disagreement with the recreational consensus. They work best combined with line movement analysis and matchup context.
How often do DraftKings betting splits update?
DraftKings betting splits update approximately every two minutes, providing near real-time insight into how the market is moving as game time approaches.
What is the best bet for Red Sox vs. Orioles Game 2?
The sharpest action in Game 2 is on BAL Orioles +1.5 on the Run Line, which commands a staggering 97% of the total handle despite receiving just 35% of individual tickets. This 62-point handle-to-bet discrepancy is the largest sharp signal across all three markets. The Moneyline also shows heavy professional lean toward Baltimore (+123), drawing 65% of handle on only 9% of bets. With Boston sending a TBD starter to the mound in the nightcap of a doubleheader, sharp money is clearly fading the Red Sox.