

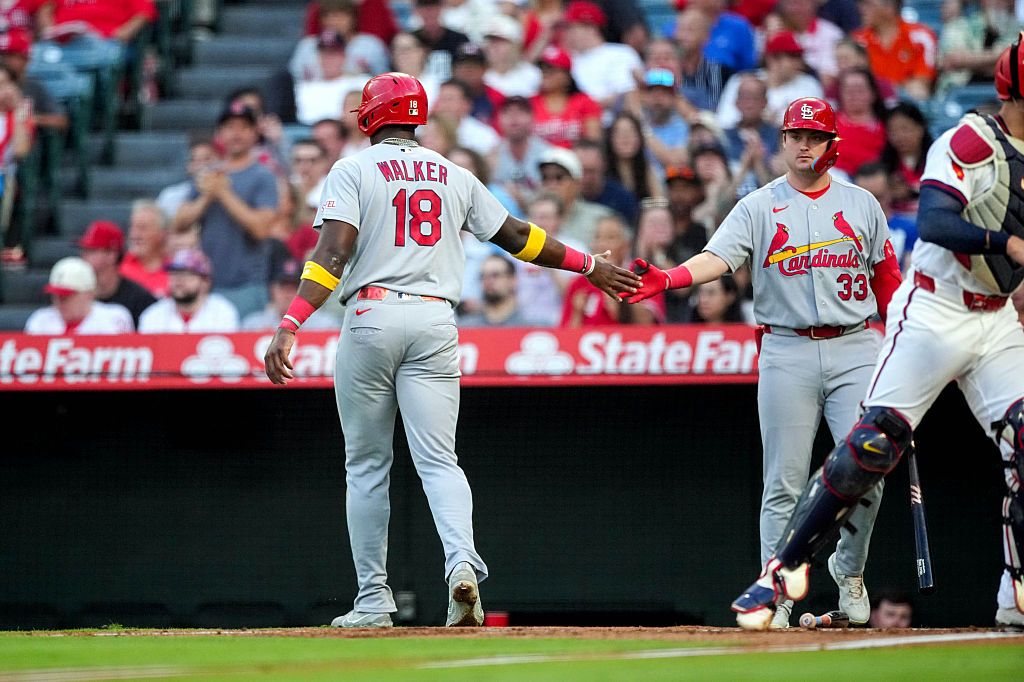
Looking for today’s Los Angeles Angels vs. St. Louis Cardinals betting splits? Below you’ll find the latest DraftKings Sportsbook betting percentages, including Moneyline, Run Line and total splits, plus where the public is betting, where larger wagers may indicate sharp money, and key matchup stats before first pitch.
Angels vs. Cardinals Odds
| Market | Angels | Cardinals |
|---|---|---|
| Moneyline | -106 | -114 |
| Run Line | +1.5 (-174) | -1.5 (+143) |
| Total | O/U 9 (Over -105 / Under -114) | |
DraftKings Betting Splits
| Market | Side | Handle % | Bets % |
|---|---|---|---|
| Moneyline | Angels | 40% | 26% |
| Moneyline | Cardinals | 60% | 74% |
| Run Line | Angels +1.5 | 1% | 70% |
| Run Line | Cardinals -1.5 | 99% | 30% |
| Total | Over 9 | 96% | 53% |
| Total | Under 9 | 4% | 47% |
Public Betting Trends
The Moneyline action leans heavily toward St. Louis, with 74% of bets backing the Cardinals at -114. However, the handle tells a more balanced story at just 60% on STL. That gap between ticket count and money wagered suggests recreational bettors are driving the Cardinals’ Moneyline popularity, while larger bettors are willing to take the Angels at a near pick’em price.
The Run Line split is where this game gets fascinating. A full 70% of bets sit on the Angels +1.5, the safer play for those backing the home underdog. Yet an eye-popping 99% of the handle is on the Cardinals -1.5 at +143. This is one of the sharpest bet-versus-handle divergences on today’s board, indicating that large, professional-style wagers are backing St. Louis to win by two or more runs.
On the total, the Over 9 is drawing 53% of tickets and a dominant 96% of the handle. With the game set for Angel Stadium under 86-degree heat and sunny skies, the combination of weather conditions and sharp money flowing to the Over suggests the market expects an offense-friendly evening.
Angels vs. Cardinals Stats
Team Batting Stats
| Stat | Angels | Cardinals |
|---|---|---|
| AVG | .239 | .242 |
| OBP | .315 | .318 |
| SLG | .388 | .387 |
| OPS | .703 | .705 |
| K% | 25.1% | 20.4% |
| BB% | 8.2% | 8.2% |
| ISO | .149 | .145 |
| BABIP | .299 | .280 |
| Runs | 437 | 446 |
Team Pitching Stats
| Stat | Angels | Cardinals |
|---|---|---|
| ERA | 4.596 | 4.147 |
| WHIP | 1.377 | 1.328 |
| K/9 | 8.98 | 7.59 |
| K/BB | 2.07 | 2.24 |
| OBA | .237 | .251 |
Starting Pitcher Stats
| Stat | Walbert Urena (LAA) | Matthew Liberatore (STL) |
|---|---|---|
| Record | 5-7 | 5-6 |
| ERA | 2.88 | 5.00 |
| WHIP | 1.316 | 1.484 |
| FIP | 3.94 | 4.87 |
| xFIP | 4.44 | 4.40 |
| K/9 | 8.63 | 8.46 |
| HR/9 | 0.55 | 1.63 |
| K% | 22.0% | 21.4% |
| BB% | 12.7% | 8.7% |
| Starts | 15 | 19 |
| Quality Starts | 6 | 4 |
Key Matchup Numbers
- Urena’s regression risk: Urena’s 2.88 ERA looks dominant, but his 4.44 xFIP and 12.7% walk rate suggest regression risk. His surface numbers may be masking vulnerability.
- Liberatore’s home run concern: Liberatore’s 1.63 HR/9 is a concern in warm, hitter-friendly conditions at Angel Stadium (86 degrees, no cloud cover, wind from the SW at 9 mph).
- Cardinals’ road edge: The Cardinals own a 25-22 road record and are the better overall club (51-48 vs. 40-61), though they enter on a three-game losing streak.
- STL road hitter production: STL’s away split leaders are producing at a high level; Jordan Walker (.283/.911 OPS, 13 HR), Alec Burleson (.299/.866, 9 HR), and JJ Wetherholt (.284/.864, 8 HR in 183 AB).
- Angels’ strikeout vulnerability: The Angels’ 25.1% team K-rate is the most exploitable offensive weakness, though Liberatore’s modest 21.4% K-rate limits his ability to capitalize on that tendency.
Despite Urena’s superior ERA, the convergence of xFIP values (4.44 vs. 4.40) paints these starters as nearly equivalent on a skills basis. The Cardinals’ deeper lineup and stronger road production explain why sharp money is siding with St. Louis, while the combined walk and home run concerns from both pitchers support an Over lean at O/U 9.
Betting Splits Summary
| Category | Public Side | Sharp Side | Edge |
|---|---|---|---|
| Moneyline | Cardinals (74% bets) | Angels (40% handle on 26% bets) | Slight sharp lean LAA |
| Run Line | Angels +1.5 (70% bets) | Cardinals -1.5 (99% handle) | Strong sharp lean STL -1.5 |
| Total | Over 9 (53% bets) | Over 9 (96% handle) | Sharp and public aligned on Over |
FAQs
What are MLB betting splits?
Betting splits show how the public is wagering on a game by breaking down the percentage of total bets (tickets) and total money (handle) on each side of a market. They help identify which side recreational bettors favor versus where larger, potentially sharper money is landing.
What is the difference between bets and handle?
Bets refer to the number of individual tickets placed, while handle represents the total dollar amount wagered. A side with low bet percentage but high handle percentage suggests fewer bettors placing larger wagers, often interpreted as sharp or professional action.
How do betting splits identify sharp money?
Sharp money refers to wagers placed by professional or highly informed bettors. It is typically identified through handle-vs-bet discrepancies: when a side draws a disproportionate share of money relative to its ticket count, sharps are likely involved.
Should you follow betting splits?
Splits are one tool among many. They are most useful when a clear divergence exists between public tickets and money handle, suggesting professional disagreement with the recreational consensus. They work best combined with line movement analysis and matchup context.
How often do DraftKings betting splits update?
DraftKings betting splits update approximately every two minutes, providing near real-time insight into how the market is moving as game time approaches.
What is the best bet for Angels vs. Cardinals?
The sharpest action by handle percentage is on St. Louis Cardinals -1.5 at +143, with 99% of dollars backing that side on just 30% of bets. The Over 9 also draws heavy sharp interest at 96% of handle. Bettors looking for value may consider the Cardinals Run Line given the significant divergence between handle and ticket count.