

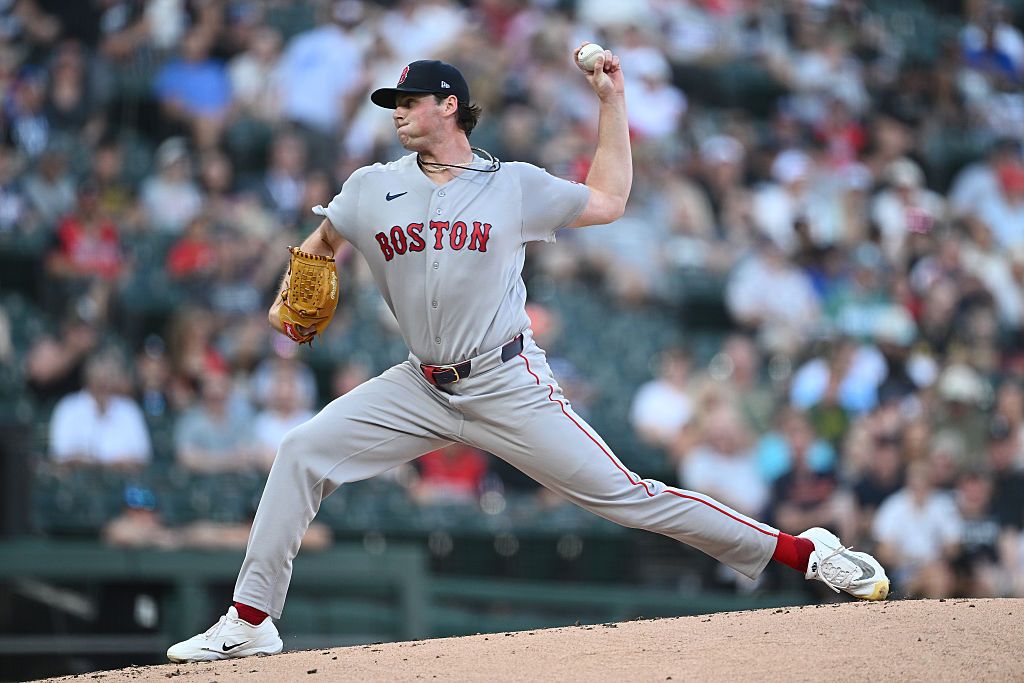
Looking for today’s Red Sox vs. Rays Game 1 betting splits? Below you’ll find the latest DraftKings Sportsbook betting percentages, Moneyline, Run Line and total splits, plus where the public is betting, where larger wagers may indicate sharp money, and key matchup stats before first pitch.
BOS Red Sox vs. TB Rays Game 1 Odds
| Market | Side | Odds |
|---|---|---|
| Moneyline | BOS Red Sox | −124 |
| Moneyline | TB Rays | +103 |
| Run Line | BOS Red Sox -1.5 | +166 |
| Run Line | TB Rays +1.5 | −203 |
| Total | Over 8 | −117 |
| Total | Under 8 | −103 |
Boston is a moderate home favorite at −124, pricing out to roughly 56% implied probability. The Run Line heavily favors the Rays to stay within 1.5 runs (−203), and the total sits at 8 with the over slightly juiced at −117.
DraftKings Betting Splits
| Market | Side | Handle % | Bets % |
|---|---|---|---|
| Moneyline | BOS Red Sox | 51% | 63% |
| Moneyline | TB Rays | 49% | 37% |
| Run Line | BOS Red Sox -1.5 | 88% | 63% |
| Run Line | TB Rays +1.5 | 12% | 37% |
| Total | Over 8 | 68% | 53% |
| Total | Under 8 | 32% | 47% |
Public Betting Trends
The Moneyline split reveals a fascinating disconnect: 63% of tickets are landing on the Red Sox, but the handle is nearly even at 51/49. That gap signals larger individual wagers on Tampa Bay. When the ticket count leans one direction, but the dollar volume stays flat, it typically indicates sharper or higher-limit bettors taking the other side.
The Run Line tells a more dramatic story. Boston is drawing 88% of the handle on -1.5, compared to just 63% of the tickets. That’s a massive concentration of money, suggesting some bettors are confident the Red Sox will win by 2 or more, yet the line hasn’t moved from +166. Books appear willing to take on that liability, which could indicate they expect the Rays to cover the spread more often than the public believes.
The total is tilted toward the over (68% of handle, 53% of tickets), consistent with what you’d expect at Fenway Park in July. Larger bets are pushing the over handle higher than ticket count alone would suggest, and the juice on the over (−117 vs. −103) reflects that early lean. An 8-run total in a Fenway day game with these two offenses leaves room for movement toward 8.5 if over action continues to build.
BOS Red Sox vs. TB Rays Game 1 Stats
Team Batting Stats
| Stat | BOS Red Sox | TB Rays |
|---|---|---|
| AVG | .243 | .259 |
| OBP | .314 | .334 |
| SLG | .387 | .401 |
| ISO | .144 | .142 |
| OPS | .701 | .735 |
| K% | 22.0% | 18.9% |
Starting Pitcher Stats
| Stat | Jake Bennett (BOS) | Griffin Jax (TB) |
|---|---|---|
| Record | 4-3 | 5-6 |
| ERA | 2.64 | 3.47 |
| WHIP | 0.94 | 1.23 |
| FIP | 3.02 | 4.42 |
| xFIP | 3.65 | 3.59 |
| WAR | 1.37 | 0.42 |
| K% | 19.2% | 24.7% |
| BB% | 3.8% | 8.4% |
| HR/9 | 0.57 | 1.54 |
Key Matchup Numbers
- Pitching Edge: Bennett owns a 2.64 ERA and elite 0.94 WHIP through 8 starts, walking just 3.8% of batters. His 3.02 FIP supports the surface results. Jax has been league-average at 3.47 ERA/1.23 WHIP, with a bloated 4.42 FIP hinting at regression, and his 1.54 HR/9 is a concern at Fenway.
- Offensive Edge: Tampa Bay holds advantages across the board in team hitting: .259/.334/.401 versus Boston’s .243/.314/.387. The Rays also strike out at just an 18.9% clip compared to 22.0% for the Red Sox, making them a tougher at-bat lineup to pitch through.
- Momentum: Boston enters on a blistering 9-game winning streak and a 9-1 last-10 run, climbing to 46-48 after a rough first half. Tampa Bay (56-38, first in the AL East) has gone 5-5 in the last 10 and arrives on a one-game skid.
- Home/Road Splits: Paradoxically, Boston has been far better on the road (29-21) than at home (17-27) this season. Tampa Bay’s road record is 21-23, making both teams somewhat vulnerable in this setting. Willson Contreras leads Red Sox home bats with a .983 OPS (10 HR), while Jonny DeLuca paces the Rays on the road at .914 OPS.
- Injury Context: Boston is without Tanner Houck, Garrett Crochet, Kutter Crawford, and Johan Oviedo on the pitching staff (all D60), plus Triston Casas and Roman Anthony in the lineup. Tampa Bay is missing Ryan Pepiot, Steven Matz, and Gavin Lux to long-term IL stints.
Bennett’s low walk rate and efficiency on the mound give Boston a clear pitching advantage, but Tampa Bay’s lineup ranks among the league’s best in OBP (.334) and contact rate (18.9% K%), the type of disciplined approach that can extend innings and neutralize a pitcher who relies on weak contact rather than strikeouts. Boston’s puzzling 17-27 home record and the Rays sitting atop the AL East help explain why this line is only −124 despite the surface-level pitching mismatch.
Betting Splits Summary
| Category | Edge |
|---|---|
| Public Betting (ML) | BOS Red Sox (63% bets) |
| Money Handle (ML) | Nearly even (51% BOS / 49% TB) |
| Run Line Handle | BOS Red Sox -1.5 (88%) |
| Total Handle | Over 8 (68%) |
| Biggest Split | Run Line handle: 88% BOS vs. 63% tickets |
FAQs
What are MLB betting splits?
MLB betting splits show the percentage of bets (tickets) and money (handle) on each side of a market. They help identify which side the general public favors and where sharper bettors may be positioned.
What is the difference between bets and handle?
Bets refer to the number of individual wagers placed, while handle is the total dollar amount wagered. A gap between the two can indicate that larger, often sharper, bettors are on one side while the general public favors the other.
What is sharp money?
Sharp money refers to wagers placed by professional or highly informed bettors. It’s often identified when the handle percentage significantly exceeds the bet percentage on a given side, or when line movement contradicts public betting trends.
Should you follow betting splits?
Betting splits are one tool among many. They work best as confirmation alongside your own analysis. Following handle over ticket count tends to be more informative, and splits are most useful when combined with line movement data.
How often do DraftKings betting splits update?
DraftKings betting splits update approximately every two minutes, giving you a near-real-time look at how public money and ticket counts are shifting as the game approaches.