

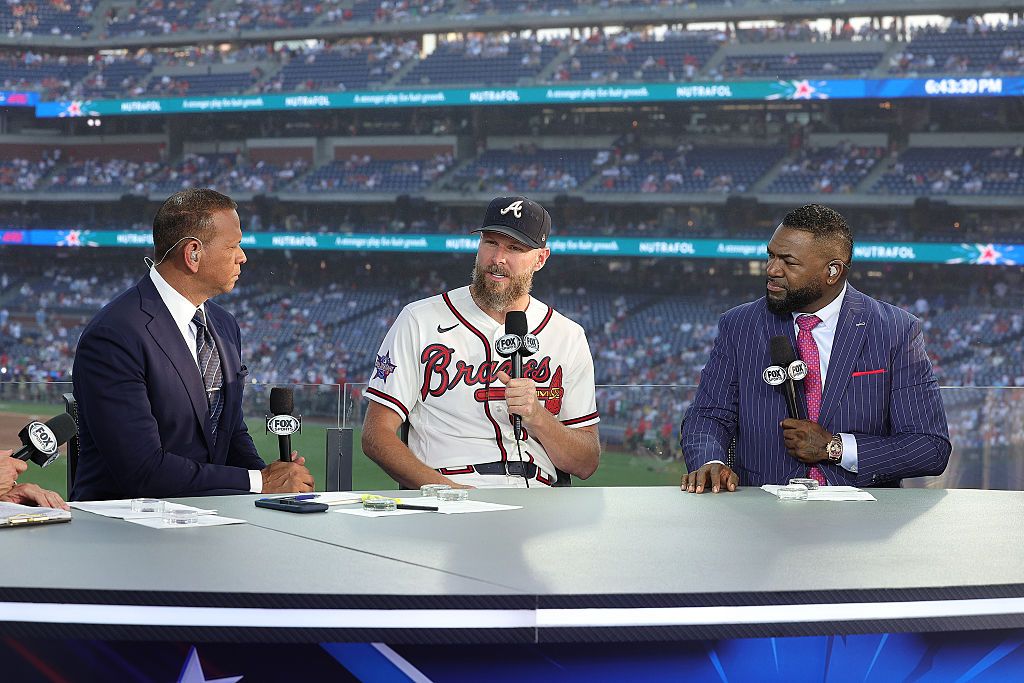
Looking for today’s Braves vs. Rangers betting splits? Below you’ll find the latest DraftKings Sportsbook betting percentages, Moneyline, Run Line and total splits, plus where the public is betting, where larger wagers may indicate sharp money, and key matchup stats before first pitch.
Braves vs. Rangers Odds
| Market | Side | Odds |
|---|---|---|
| Moneyline | ATL Braves | −217 |
| Moneyline | TEX Rangers | +177 |
| Run Line | ATL Braves -1.5 | +100 |
| Run Line | TEX Rangers +1.5 | −120 |
| Total | Over 8 | −110 |
| Total | Under 8 | −110 |
Atlanta is a heavy home favorite at −217, implying roughly 68% win probability. The Run Line is set at even money for the Braves -1.5, making it one of the more aggressively priced Run Lines on the board. The total sits at O/U 8 with even juice on both sides.
DraftKings Betting Splits
| Market | Side | Handle % | Bets % |
|---|---|---|---|
| Moneyline | ATL Braves | 77% | 91% |
| Moneyline | TEX Rangers | 23% | 9% |
| Run Line | ATL Braves -1.5 | 99% | 75% |
| Run Line | TEX Rangers +1.5 | 1% | 25% |
| Total | Over 8 | 64% | 32% |
| Total | Under 8 | 36% | 68% |
Public Betting Trends
The Moneyline shows overwhelming public consensus: 91% of tickets and 77% of handle are on Atlanta. The fact that handle (77%) actually lags ticket count (91%) is notable. It suggests that while casual bettors are piling on the Braves at −217, some larger wagers are finding value on Texas at +177. When the public is this lopsided but money doesn’t fully follow, it often signals at least some informed interest on the underdog.
The Run Line is even more extreme. A staggering 99% of the handle is on Atlanta -1.5 at even money, far outpacing the 75% ticket share. This is sharp-money alignment with the public: big bettors love the Braves to win by 2+ at +100 odds, viewing it as a value spot given Sale’s dominance. Books are essentially offering a coin-flip price on whether the best pitcher in baseball wins comfortably at home.
The total market flips the script. While 68% of tickets lean under, 64% of the handle is on Over 8. Larger bettors are betting against the conventional wisdom that Sale starts suppressing scoring, perhaps anticipating that Quantrill’s contact-heavy approach could allow the Atlanta lineup to put up runs and offset any low-scoring effort by Sale against Texas.
Braves vs. Rangers Stats
Team Batting Stats
| Stat | ATL Braves | TEX Rangers |
|---|---|---|
| AVG | .246 | .245 |
| OBP | .313 | .320 |
| SLG | .409 | .399 |
| ISO | .163 | .154 |
| OPS | .722 | .719 |
| K% | 21.3% | 22.4% |
Starting Pitcher Stats
| Stat | Chris Sale (ATL) | Cal Quantrill (TEX) |
|---|---|---|
| Record | 9-6 | 3-1 |
| ERA | 2.20 | 3.11 |
| WHIP | 1.11 | 1.14 |
| FIP | 2.82 | 4.74 |
| xFIP | 3.07 | 5.41 |
| WAR | 2.75 | 0.16 |
| K% | 29.0% | 14.5% |
| BB% | 6.2% | 6.2% |
| HR/9 | 0.74 | 1.17 |
Key Matchup Numbers
- Pitching Mismatch: Sale’s 2.20 ERA, 2.82 FIP, and 29.0% K rate make him one of the elite arms in baseball this season. Quantrill’s 3.11 ERA looks respectable on the surface, but his 4.74 FIP and 5.41 xFIP suggest massive regression is coming, driven by a 14.5% K rate that leaves him entirely reliant on weak contact and defense.
- Offensive Similarity: These teams are nearly identical offensively (.722 OPS vs. .719), but Atlanta carries a slight edge in power (ISO .163 vs. .154) and strikeout avoidance (21.3% vs. 22.4%). Neither offense has been dominant in 2026.
- Home Dominance: Atlanta is 27-18 at Truist Park and leads the NL East at 55-40. Ozzie Albies (.831 OPS, 9 HR) and Matt Olson (.802 OPS, 9 HR) anchor a home lineup that has consistently produced. Texas is a flat 25-25 on the road.
- Rotation Depth: Atlanta is missing Strider, Schwellenbach, Smith-Shawver, and Perez from the rotation to injuries, making Sale’s starts even more critical. Texas is without Montgomery and Leiter, leaving Quantrill (only 4 starts this season) as a fill-in rather than a trusted arm.
- Road Bats to Watch: Texas brings Corey Seager (.842 OPS, 8 HR on the road despite a .208 AVG), Brandon Nimmo (.855 OPS, 7 HR), and Joc Pederson (.875 OPS, 5 HR) as legitimate threats capable of tagging even elite pitching.
This is a classic ace-versus-fill-in matchup that the market is pricing aggressively. Sale’s combination of strikeout dominance and home run suppression (0.74 HR/9) makes him a nightmare for a Rangers lineup that will need to put balls in play against a pitcher who simply doesn’t allow it at a 29% clip. Quantrill’s extreme contact approach (14.5% K%) could work against him if Atlanta’s power bats catch balls in the air at Truist Park, and his underlying metrics (5.41 xFIP) scream vulnerability despite the tidy 3.11 ERA.
Betting Splits Summary
| Category | Edge |
|---|---|
| Public Betting (ML) | ATL Braves (91% bets) |
| Money Handle (ML) | ATL Braves (77%) |
| Run Line Handle | ATL Braves -1.5 (99%) |
| Total Handle | Over 8 (64%) |
| Biggest Split | Run Line handle: 99% ATL vs. 75% tickets |
FAQs
What are MLB betting splits?
MLB betting splits show the percentage of bets (tickets) and money (handle) on each side of a market. They help identify which side the general public favors and where sharper bettors may be positioned.
What is the difference between bets and handle?
Bets refer to the number of individual wagers placed, while handle is the total dollar amount wagered. A gap between the two can indicate that larger, often sharper, bettors are on one side while the general public favors the other.
What is sharp money?
Sharp money refers to wagers placed by professional or highly informed bettors. It’s often identified when the handle percentage significantly exceeds the bet percentage on a given side, or when line movement contradicts public betting trends.
Should you follow betting splits?
Betting splits are one tool among many. They work best as confirmation alongside your own analysis. Following handle over ticket count tends to be more informative, and splits are most useful when combined with line movement data.
How often do DraftKings betting splits update?
DraftKings betting splits update approximately every two minutes, giving you a near-real-time look at how public money and ticket counts are shifting as the game approaches.