On the road again! NASCAR can’t wait to get back on the road. The Cup Series heads west for another road course. From Chicago to Sonoma, from the Windy City to Wine Country, stock cars are turning right—and that’s all right. Here are the best bets for the NASCAR Cup Series Toyota/Save Mart 350 at Sonoma Raceway.
For DraftKings Sportsbook NASCAR Picks from the lower series, follow @Race4thePrize on Twitter.
Race Winner — Toyota Save Mart 350 at Sonoma
Shane Van Gisbergen +130
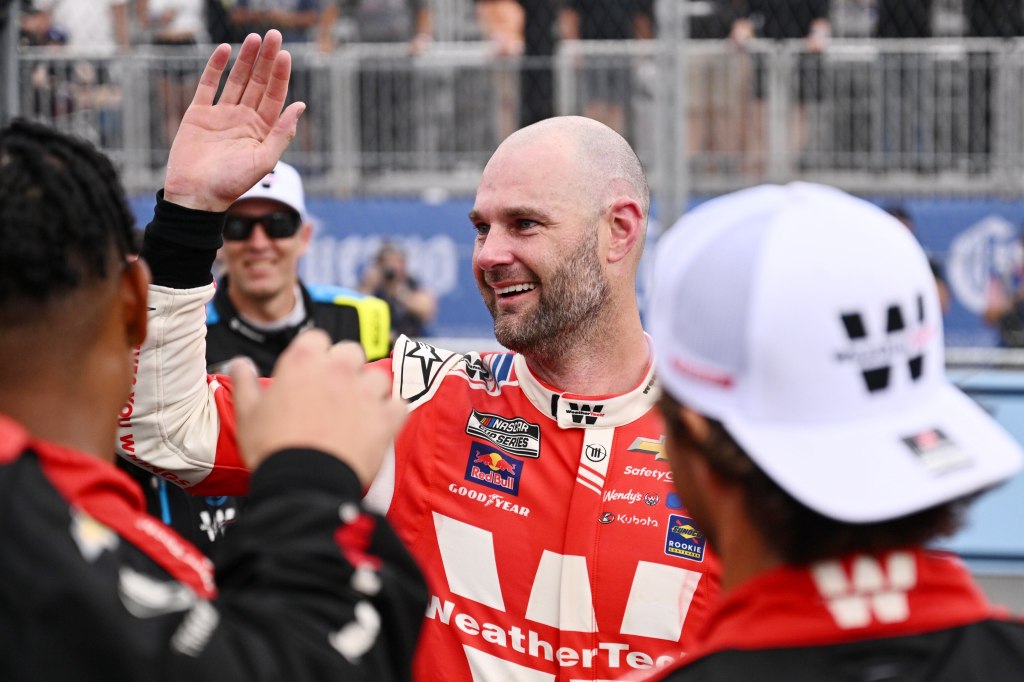
The payout isn’t very lucrative, but it delivers. SVG was the best bet last week in Chicago, and that bet paid off. The other 39 bets did not. Rinse and repeat. Copy and paste. Cup Series drivers admit they’re not in the Kiwi’s league. The elite are resigned to runner-up, podium, or top-five finishes—and they don’t seem to mind. SVG is the Michael Jordan of road courses. This is his first Cup Series race at Sonoma, where he previously won his first Xfinity Series race and led the most laps.
There are no guarantees in sports betting, and locks don’t exist in auto racing. But SVG is as close to a sure thing as it gets. Shane is smooth—pure poetry in motion. The Supercar champ glides through the esses, while the rest of the field are bulls in a china shop. Others may muscle their way forward on this technical track, but van Gisbergen finesses his path. Strategy and luck play roles, but talent matters most at Sonoma.
Race Winner — Toyota Save Mart 350 at Sonoma
Chase Elliott +1400
A road course is like a superspeedway lite—that’s the general consensus in DFS. This holds true for most tracks, where strategy, weather, and YOLO turns trigger the road-course version of the Big One on restarts. But Sonoma is different. It’s a proper road course. Strategy still matters, but it lacks the chaotic weather or infamous turn that wipes out a quarter of the field. This means skill matters most, and thus, stats matter.
What’s better than advanced stats? Let the squares bet on finishing position or even average running position. Advanced stats are more comprehensive and predictive.
- wARP (Weighted Average Running Position) — Laps in the later stages of a race are more predictive of final results. The average running position on these later-stage laps carries more weight in calculating a driver’s overall average running position.
- cPOMS (Continuously Graded Percent of Max Speed) — A driver’s speed on each lap is compared to the fastest lap speed recorded by any driver on that lap.
- SS (Speed Score) — A driver’s 95th percentile lap time is compared to the race’s 95th percentile lap time, or their best lap is compared to the race’s best lap—a measure of top speed.
- PGAE/100 (Average Positions Gained Above Expected per 100 Laps) — Measures a driver’s passing ability. For example, if a driver moves from 15th on lap 10 to 14th on lap 11, they gain one position. This metric compares a driver’s position changes to historical data: Where does the 15th-place driver on lap 10 typically finish on lap 11? Do they hold position, move forward, or fall back, and by how many spots?
We can standardize these data points across the field on a bell curve, from high to low. The data are clear: Chase Elliott is the top road-course driver in the Gen-7 car. His wARP is in the 97th percentile, though in integer form—a skewed metric that understates the gap between the best and worst drivers—he ranks third. His cPOMS and SS are both in the 99th percentile, each ranking second overall. If it’s not SVG’s day, it’s Elliott’s turn to chug the jug of wine.